

Question
Q: Write three research questions based on the variables in the table and answer them using the statistics provided. Could you come up with some
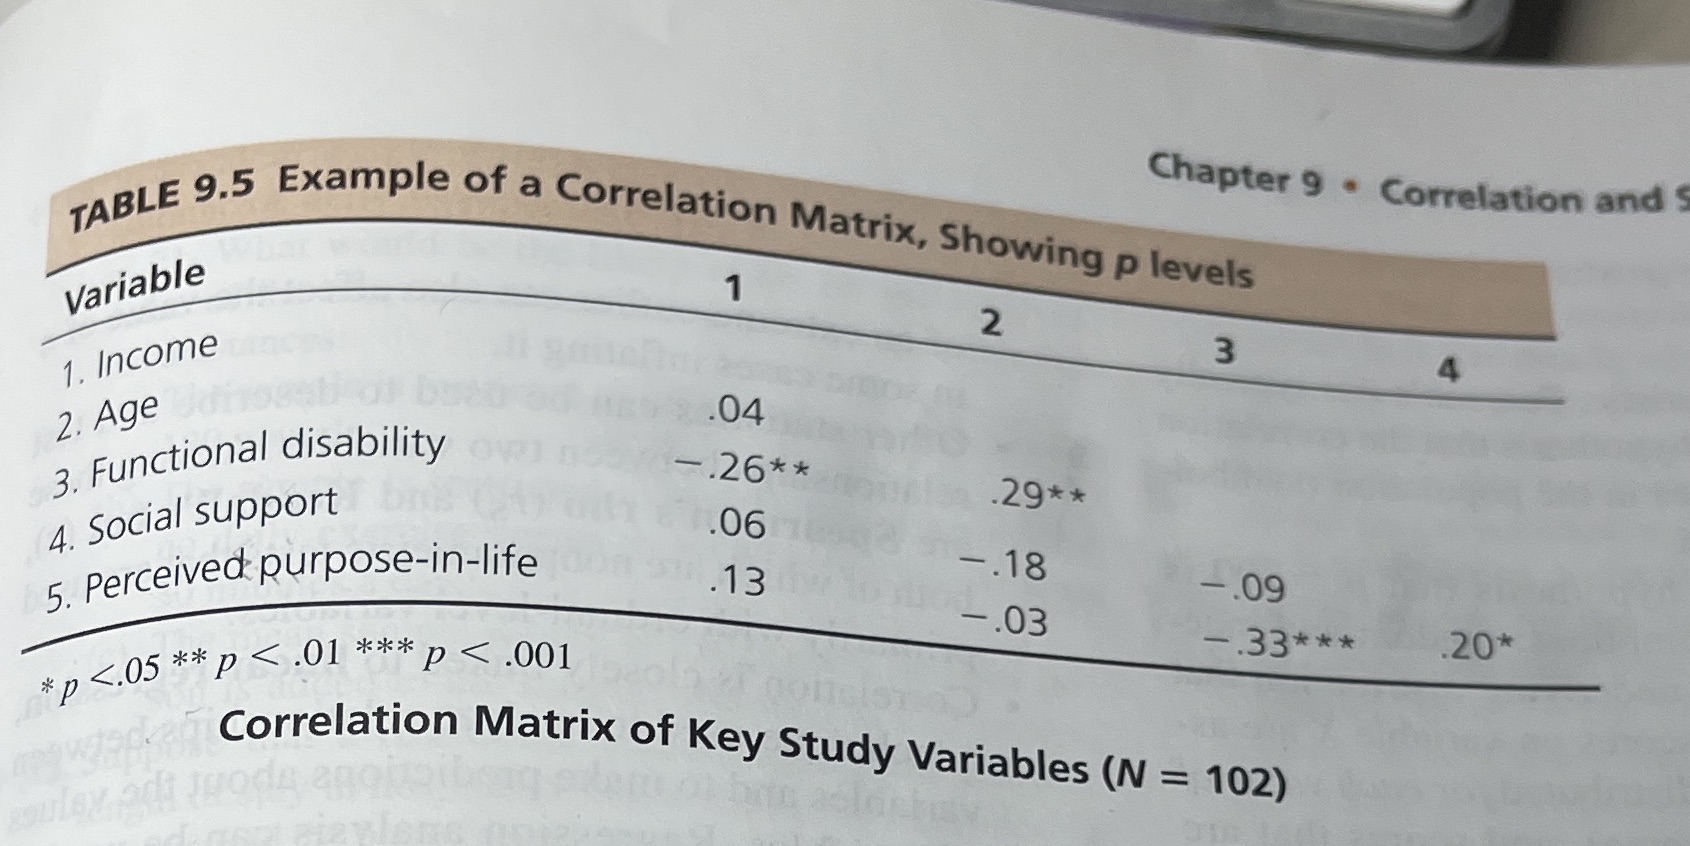
Q: Writethreeresearch questions based on the variables in the table and answer them using the statistics provided. Could you come up with some explanations for the results?
(I have a table but can not attach do you have any suggestions on how to display this table that goes with my question to you?)
My questions are based on the table:
- What is the correlation coefficient for perceived purpose-in-life and functional disability? Is it statistically significant, and if so, at what level?
a.The correlation coefficient for perceived purpose-in-life and functional disability is -.33. Yes, it is statistically significant at the .001 level. The dependant variable is age and the independent variable is the perceived purpose in life. The negative coefficient is suggesting that the independent variable (age) increases and the dependant variable (perceived purpose in life ) decreases.
- What is the weakest correlation coefficient in the matrix?
.The weakest correlation coefficient in the matrix is -.03, for perceived purpose-in-life and age.
- What percent of variance does functional disability and age share?
Functional disability shares an 8% variance with age (r= .08).
Step by Step Solution
There are 3 Steps involved in it
Step: 1

Get Instant Access to Expert-Tailored Solutions
See step-by-step solutions with expert insights and AI powered tools for academic success
Step: 2

Step: 3
Ace Your Homework with AI
Get the answers you need in no time with our AI-driven, step-by-step assistance
Get Started
An Introduction to the Mathematics of financial Derivatives
Authors: Salih N. Neftci
2nd Edition
978-0125153928, 9780080478647, 125153929, 978-0123846822