

Answered step by step
Verified Expert Solution
Question
1 Approved Answer
Q1 Draw a total of 15 samples (of 5 values each) from the given data set in Table 1 below Name sample Measurements 1 2
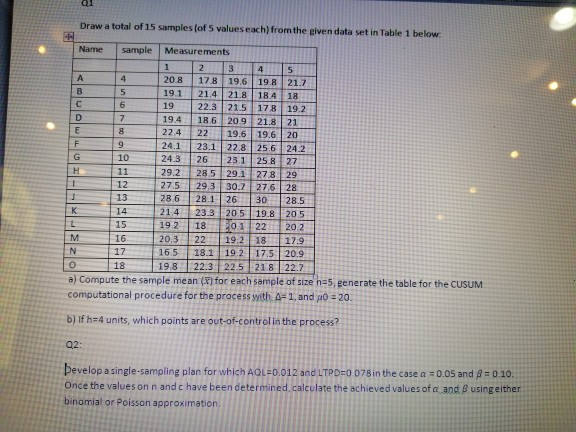
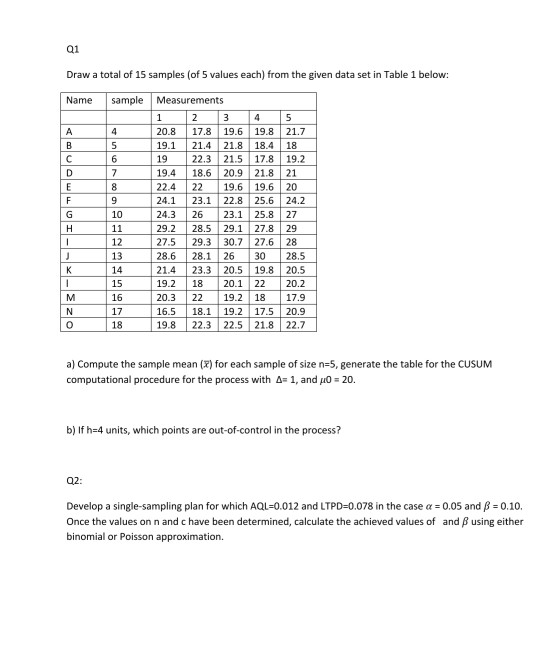
Q1 Draw a total of 15 samples (of 5 values each) from the given data set in Table 1 below Name sample Measurements 1 2 3 4 5 A 4 20.8 17.8 19.6 19.8 21.7 B 5 19.1 21.4 21.8 18.4 18 6 19 22.3 21.5 178 19.2 D 7 19.4 186 20.921.821 E 22.4 22 19.6 19.6 20 F 9 24.1 23.1 22.8 25.6 24.2 G 10 24.3 26 23.1 25.827 11 29.2 285 29.1 27.829 1 12 27.5 29.3 30.7 27.628 13 28.6 28.126 30 28.5 14 21.4 23.3 20.5 19.8 205 2 15 192 18 201 22 202 M 16 20,3 22 19.218 17.9 N 17 16.5 18.1 19.2 17.5 20.9 o 18 19.8 22.3 22.5 21.822.7 a) Compute the sample mean (B) for each sample of size n=5, generate the table for the CUSUM computational procedure for the process with 4-1, and so = 20 1 + b) If h=4 units, which points are out-of-control in the process? 02: Develop a single-sampling plan for which AQL=0.012 and LTPDEO 078 in the case a = 0.05 and 8 = 0.10 Once the values on n and c have been determined calculate the achieved values of a and using either binomial or Poisson approximation Q1 Draw a total of 15 samples (of 5 values each) from the given data set in Table 1 below: Name | 3 A B D E F G . sample Measurements 1 2 5 4 20.8 17.8 19.6 19.8 21.7 5 19.1 21.4 21.8 18.4 18 6 19 22.3 21.5 17.8 19.2 7 19.4 18.6 20.9 21.8 21 8 22.4 22 19.6 19.6 20 9 24.1 23.1 22.8 25.6 24.2 10 24.3 26 23.1 25.8 | 27 11 29.2 28.5 29.1 27.8 29 12 27.5 29.3 30.7 27.6 28 13 28.6 28.1 26 30 28.5 14 21.4 23.3 20.5 19.8 20.5 15 19.2 18 20.1 22 20.2 16 20.3 22 19.2 18 17.9 17 16.5 18.1 19.2 17.5 20.9 18 19.8 22.3 22.5 21.8 22.7 Huuuuuuuuu - K 1 M N 0 tutto a) Compute the sample mean (X) for each sample of size n=5, generate the table for the CUSUM computational procedure for the process with A= 1, and = 20. b) If h=4 units, which points are out-of-control in the process? Q2: Develop a single-sampling plan for which AQL=0.012 and LTPD=0.078 in the case a = 0.05 and = 0.10. Once the values on n and chave been determined, calculate the achieved values of and B using either binomial or Poisson approximation. Q1 Draw a total of 15 samples (of 5 values each) from the given data set in Table 1 below Name sample Measurements 1 2 3 4 5 A 4 20.8 17.8 19.6 19.8 21.7 B 5 19.1 21.4 21.8 18.4 18 6 19 22.3 21.5 178 19.2 D 7 19.4 186 20.921.821 E 22.4 22 19.6 19.6 20 F 9 24.1 23.1 22.8 25.6 24.2 G 10 24.3 26 23.1 25.827 11 29.2 285 29.1 27.829 1 12 27.5 29.3 30.7 27.628 13 28.6 28.126 30 28.5 14 21.4 23.3 20.5 19.8 205 2 15 192 18 201 22 202 M 16 20,3 22 19.218 17.9 N 17 16.5 18.1 19.2 17.5 20.9 o 18 19.8 22.3 22.5 21.822.7 a) Compute the sample mean (B) for each sample of size n=5, generate the table for the CUSUM computational procedure for the process with 4-1, and so = 20 1 + b) If h=4 units, which points are out-of-control in the process? 02: Develop a single-sampling plan for which AQL=0.012 and LTPDEO 078 in the case a = 0.05 and 8 = 0.10 Once the values on n and c have been determined calculate the achieved values of a and using either binomial or Poisson approximation Q1 Draw a total of 15 samples (of 5 values each) from the given data set in Table 1 below: Name | 3 A B D E F G . sample Measurements 1 2 5 4 20.8 17.8 19.6 19.8 21.7 5 19.1 21.4 21.8 18.4 18 6 19 22.3 21.5 17.8 19.2 7 19.4 18.6 20.9 21.8 21 8 22.4 22 19.6 19.6 20 9 24.1 23.1 22.8 25.6 24.2 10 24.3 26 23.1 25.8 | 27 11 29.2 28.5 29.1 27.8 29 12 27.5 29.3 30.7 27.6 28 13 28.6 28.1 26 30 28.5 14 21.4 23.3 20.5 19.8 20.5 15 19.2 18 20.1 22 20.2 16 20.3 22 19.2 18 17.9 17 16.5 18.1 19.2 17.5 20.9 18 19.8 22.3 22.5 21.8 22.7 Huuuuuuuuu - K 1 M N 0 tutto a) Compute the sample mean (X) for each sample of size n=5, generate the table for the CUSUM computational procedure for the process with A= 1, and = 20. b) If h=4 units, which points are out-of-control in the process? Q2: Develop a single-sampling plan for which AQL=0.012 and LTPD=0.078 in the case a = 0.05 and = 0.10. Once the values on n and chave been determined, calculate the achieved values of and B using either binomial or Poisson approximation
Step by Step Solution
There are 3 Steps involved in it
Step: 1

Get Instant Access to Expert-Tailored Solutions
See step-by-step solutions with expert insights and AI powered tools for academic success
Step: 2

Step: 3
Ace Your Homework with AI
Get the answers you need in no time with our AI-driven, step-by-step assistance
Get Started
Custom Edition For University Of Central Florida From Managerial Accounting
Authors: Karen Wilken Braun, Wendy Tietz
3rd Edition
1269451839, 978-1269451833