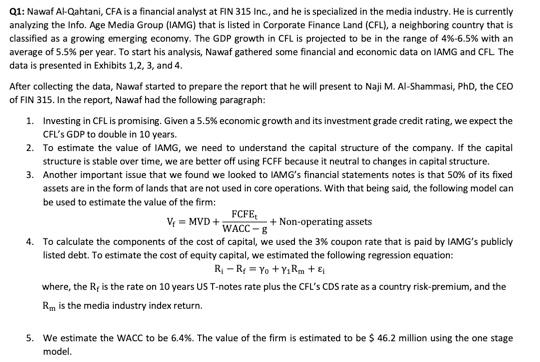
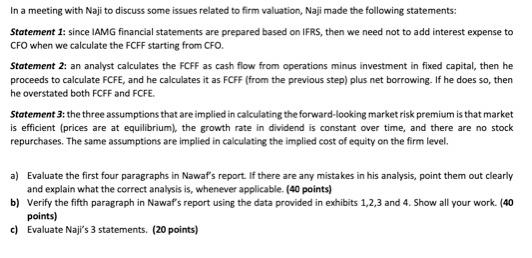
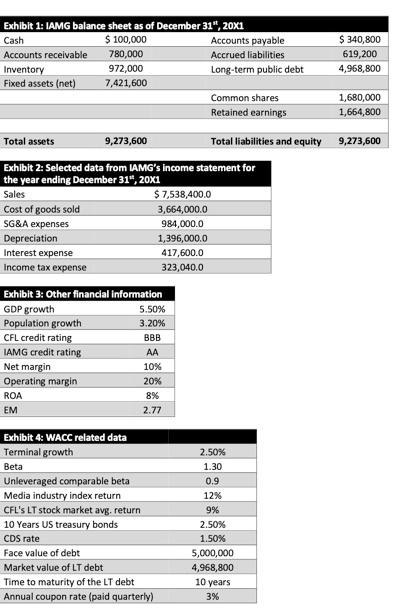
Q1: Nawaf Al-Qahtani, CFA is a financial analyst at FIN 315 Inc., and he is specialized in the media industry. He is currently analyzing the Info. Age Media Group (IAMG) that is listed in Corporate Finance Land (CFL), a neighboring country that is classified as a growing emerging economy. The GDP growth in CFL is projected to be in the range of 4%-6.5% with an average of 5.5% per year. To start his analysis, Nawaf gathered some financial and economic data on IAMG and CFL The data is presented in Exhibits 1,2,3, and 4. After collecting the data, Nawaf started to prepare the report that he will present to Naji M. Al-Shammasi, PhD, the CEO of FIN 315. In the report, Nawaf had the following paragraph: 1. Investing in CFL is promising. Given a 5.5% economic growth and its investment grade credit rating, we expect the CFL's GDP to double in 10 years. 2. To estimate the value of IAMG, we need to understand the capital structure of the company. If the capital structure is stable over time, we are better off using FCFF because it neutral to changes in capital structure. 3. Another important issue that we found we looked to IAMG's financial statements notes is that 50% of its fixed assets are in the form of lands that are not used in core operations. With that being said, the following model can be used to estimate the value of the firm: FCFE V = MVD+ WACC - 8 + Non-operating assets 4. To calculate the components of the cost of capital, we used the 3% coupon rate that is paid by IAMG's publicly listed debt. To estimate the cost of equity capital, we estimated the following regression equation: R-Ry = y + y Rm+ where, the Re is the rate on 10 years US T-notes rate plus the CFL's CDS rate as a country risk-premium, and the Rm is the media industry index return. $. We estimate the WACC to be 6.4%. The value of the firm is estimated to be $ 46.2 million using the one stage model. In a meeting with Naji to discuss some issues related to firm valuation, Naji made the following statements: Statement 1: since IAMG financial statements are prepared based on IFRS, then we need not to add interest expense to CFO when we calculate the FCFF starting from CFO. Statement 2: an analyst calculates the FCFF as cash flow from operations minus investment in fixed capital, then he proceeds to calculate FCFE, and he calculates it as FCFF (from the previous step) plus net borrowing. If he does so, then he overstated both FCFF and FCFE. Statement 3: the three assumptions that are implied in calculating the forward-looking market risk premium is that market is efficient (prices are at equilibrium), the growth rate in dividend is constant over time, and there are no stock repurchases. The same assumptions are implied in calculating the implied cost of equity on the firm level. a) Evaluate the first four paragraphs in Nawaf's report. If there are any mistakes in his analysis, point them out clearly and explain what the correct analysis is, whenever applicable. (40 points) b) Verify the fifth paragraph in Nawaf's report using the data provided in exhibits 1,2,3 and 4. Show all your work. (40 points) c) Evaluate Naji's 3 statements. (20 points) Exhibit 1: IAMG balance sheet as of December 31", 20X1 Cash $ 100,000 Accounts payable $ 340,800 Accounts receivable 780,000 Accrued liabilities 619,200 Inventory 972,000 Long-term public debt 4,968,800 Fixed assets (net) 7,421,600 Common shares 1,680,000 Retained earnings 1,664,800 Total assets 9,273,600 Total liabilities and equity 9,273,600 Exhibit 2: Selected data from IAMG's income statement for the year ending December 31", 20X1 Sales $ 7,538,400.0 Cost of goods sold 3,664,000.0 SG&A expenses 984,000.0 Depreciation 1,396,000.0 Interest expense 417,600.0 Income tax expense 323,040.0 Exhibit 3: Other financial information GDP growth 5.50% Population growth 3.20% CFL credit rating BBB IAMG credit rating AA Net margin 10% Operating margin 20% ROA 8% EM 2.77 Exhibit 4: WACC related data Terminal growth Beta Unleveraged comparable beta Media industry index return CFL'S LT stock market avg. return 10 Years US treasury bonds CDS rate Face value of debt Market value of LT debt Time to maturity of the LT debt Annual coupon rate (paid quarterly) 2.50% 1.30 0.9 12% 9% 2.50% 1.50% 5,000,000 4,968,800 10 years 3% Q1: Nawaf Al-Qahtani, CFA is a financial analyst at FIN 315 Inc., and he is specialized in the media industry. He is currently analyzing the Info. Age Media Group (IAMG) that is listed in Corporate Finance Land (CFL), a neighboring country that is classified as a growing emerging economy. The GDP growth in CFL is projected to be in the range of 4%-6.5% with an average of 5.5% per year. To start his analysis, Nawaf gathered some financial and economic data on IAMG and CFL The data is presented in Exhibits 1,2,3, and 4. After collecting the data, Nawaf started to prepare the report that he will present to Naji M. Al-Shammasi, PhD, the CEO of FIN 315. In the report, Nawaf had the following paragraph: 1. Investing in CFL is promising. Given a 5.5% economic growth and its investment grade credit rating, we expect the CFL's GDP to double in 10 years. 2. To estimate the value of IAMG, we need to understand the capital structure of the company. If the capital structure is stable over time, we are better off using FCFF because it neutral to changes in capital structure. 3. Another important issue that we found we looked to IAMG's financial statements notes is that 50% of its fixed assets are in the form of lands that are not used in core operations. With that being said, the following model can be used to estimate the value of the firm: FCFE V = MVD+ WACC - 8 + Non-operating assets 4. To calculate the components of the cost of capital, we used the 3% coupon rate that is paid by IAMG's publicly listed debt. To estimate the cost of equity capital, we estimated the following regression equation: R-Ry = y + y Rm+ where, the Re is the rate on 10 years US T-notes rate plus the CFL's CDS rate as a country risk-premium, and the Rm is the media industry index return. $. We estimate the WACC to be 6.4%. The value of the firm is estimated to be $ 46.2 million using the one stage model. In a meeting with Naji to discuss some issues related to firm valuation, Naji made the following statements: Statement 1: since IAMG financial statements are prepared based on IFRS, then we need not to add interest expense to CFO when we calculate the FCFF starting from CFO. Statement 2: an analyst calculates the FCFF as cash flow from operations minus investment in fixed capital, then he proceeds to calculate FCFE, and he calculates it as FCFF (from the previous step) plus net borrowing. If he does so, then he overstated both FCFF and FCFE. Statement 3: the three assumptions that are implied in calculating the forward-looking market risk premium is that market is efficient (prices are at equilibrium), the growth rate in dividend is constant over time, and there are no stock repurchases. The same assumptions are implied in calculating the implied cost of equity on the firm level. a) Evaluate the first four paragraphs in Nawaf's report. If there are any mistakes in his analysis, point them out clearly and explain what the correct analysis is, whenever applicable. (40 points) b) Verify the fifth paragraph in Nawaf's report using the data provided in exhibits 1,2,3 and 4. Show all your work. (40 points) c) Evaluate Naji's 3 statements. (20 points) Exhibit 1: IAMG balance sheet as of December 31", 20X1 Cash $ 100,000 Accounts payable $ 340,800 Accounts receivable 780,000 Accrued liabilities 619,200 Inventory 972,000 Long-term public debt 4,968,800 Fixed assets (net) 7,421,600 Common shares 1,680,000 Retained earnings 1,664,800 Total assets 9,273,600 Total liabilities and equity 9,273,600 Exhibit 2: Selected data from IAMG's income statement for the year ending December 31", 20X1 Sales $ 7,538,400.0 Cost of goods sold 3,664,000.0 SG&A expenses 984,000.0 Depreciation 1,396,000.0 Interest expense 417,600.0 Income tax expense 323,040.0 Exhibit 3: Other financial information GDP growth 5.50% Population growth 3.20% CFL credit rating BBB IAMG credit rating AA Net margin 10% Operating margin 20% ROA 8% EM 2.77 Exhibit 4: WACC related data Terminal growth Beta Unleveraged comparable beta Media industry index return CFL'S LT stock market avg. return 10 Years US treasury bonds CDS rate Face value of debt Market value of LT debt Time to maturity of the LT debt Annual coupon rate (paid quarterly) 2.50% 1.30 0.9 12% 9% 2.50% 1.50% 5,000,000 4,968,800 10 years 3%