Answered step by step
Verified Expert Solution
Question
1 Approved Answer
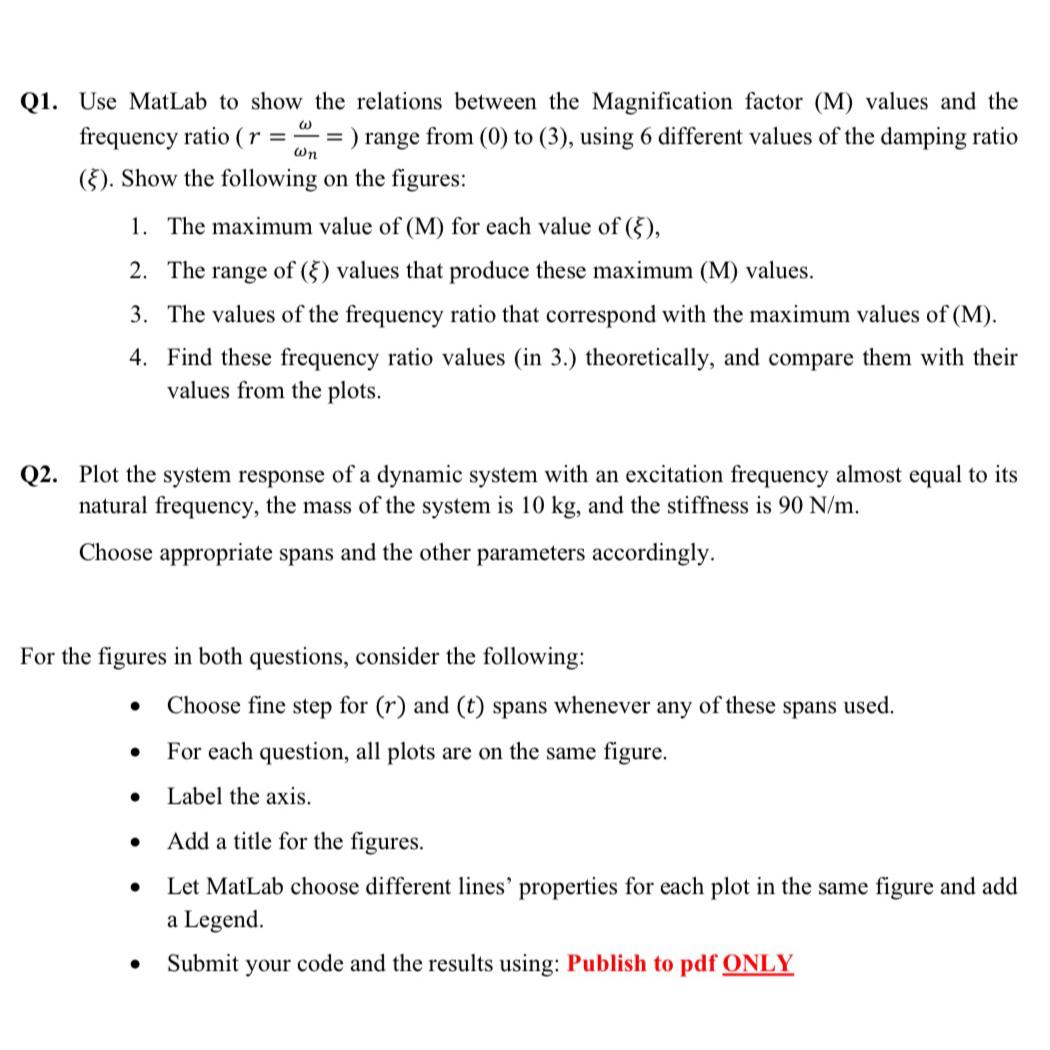
Q1. Use MatLab to show the relations between the Magnification factor (M) values and the frequency ratio (r = =) range from (0) to

Q1. Use MatLab to show the relations between the Magnification factor (M) values and the frequency ratio (r = =) range from (0) to (3), using 6 different values of the damping ratio (5). Show the following on the figures: @ 1. The maximum value of (M) for each value of (), 2. The range of (5) values that produce these maximum (M) values. 3. The values of the frequency ratio that correspond with the maximum values of (M). 4. Find these frequency ratio values (in 3.) theoretically, and compare them with their values from the plots. Wn Q2. Plot the system response of a dynamic system with an excitation frequency almost equal to its natural frequency, the mass of the system is 10 kg, and the stiffness is 90 N/m. Choose appropriate spans and the other parameters accordingly. For the figures in both questions, consider the following: Choose fine step for (r) and (t) spans whenever any of these spans used. For each question, all plots are on the same figure. Label the axis. Add a title for the figures. Let MatLab choose different lines' properties for each plot in the same figure and add a Legend. Submit your code and the results using: Publish to pdf ONLY
Step by Step Solution
★★★★★
3.47 Rating (150 Votes )
There are 3 Steps involved in it
Step: 1
Q1 Relations between Magnification Factor and Frequency Ratio Heres an example MATLAB code that can help you plot the relations between the Magnificat...
Get Instant Access to Expert-Tailored Solutions
See step-by-step solutions with expert insights and AI powered tools for academic success
Step: 2

Step: 3

Ace Your Homework with AI
Get the answers you need in no time with our AI-driven, step-by-step assistance
Get Started


