

Question
Q13.1. Refer to the figure above. Line A is the: A. total revenue line. B. fixed cost line. C. variable cost line. D. total cost
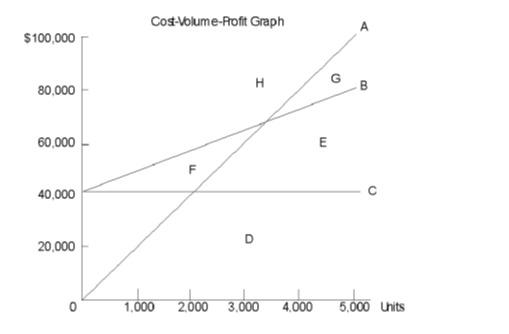
Q13.1. Refer to the figure above. Line A is the: A. total revenue line. B. fixed cost line. C. variable cost line. D. total cost line. E. profit line.
Q13.2. Refer to the figure above. Line C represents the level of: A. fixed cost. B. variable cost. C. semi-variable cost. D. total cost. E. mixed cost.
Q13.3. Refer to the figure above. The slope of line A is equal to the: A. fixed cost per unit. B. selling price per unit. C. profit per unit. D. variable cost per unit. E. unit contribution margin.
Q13.4. Refer to the figure above. The slope of line B is equal to the: A. fixed cost per unit. B. selling price per unit. C. variable cost per unit. D. profit per unit. E. unit contribution margin.
Q13.5. Refer to the figure above. The vertical distance between the total cost line and the total revenue line represents: A. fixed cost. B. variable cost. C. profit or loss at that volume. D. semi-variable cost. E. the safety margin.
Q13.6. Refer to the figure above. Assume that the company whose cost structure is depicted in the figure expects to produce a loss for the upcoming period. The loss would be shown on the graph: A. by the area immediately above the break-even point. B. by the area immediately below the total cost line. C. by the area diagonally to the right of the break-even point. D. by the area diagonally to the left of the break-even point. E. in some other area not mentioned above.
Q13.7. Refer to the figure above. At a given sales volume, the vertical distance between the fixed cost line and the total cost line represents: A. fixed cost. B. variable cost. C. profit or loss at that volume. D. semi-variable cost. E. the safety margin.
Q13.8. Refer to the figure above. Assume that the company whose cost structure is depicted in the figure expects to produce a profit for the upcoming accounting period. The profit would be shown on the graph by the letter: A. D. B. E. C. F. D. G. E. H.
Cost-Volume-Profit Graph $100,000 H 80,000 60,000 - E 40,000 20,000 0 1.000 2.000 3.000 4.000 5.000 unitsStep by Step Solution
There are 3 Steps involved in it
Step: 1

Get Instant Access to Expert-Tailored Solutions
See step-by-step solutions with expert insights and AI powered tools for academic success
Step: 2

Step: 3
Ace Your Homework with AI
Get the answers you need in no time with our AI-driven, step-by-step assistance
Get Started
Crash Course Medical Research Audit And Teaching The Essentials For Career Success
Authors: Amit Kaura MSc BSc MB ChB MRCP AFHEA AMInstLM, Darrel Francis, Shreelata T Datta MD MRCOG LLM MBBS BSc, Philip Xiu MA MB BChir MRCP MRCGP MScClinEd FHEA MAcadMEd RCPathME
2nd Edition
0702073784, 978-0702073786