Answered step by step
Verified Expert Solution
Link Copied!

Question

1 Approved Answer

= . . . . Q2. [15] With x in range between 0 and 5, generate two 500 samples signal and plot them on one
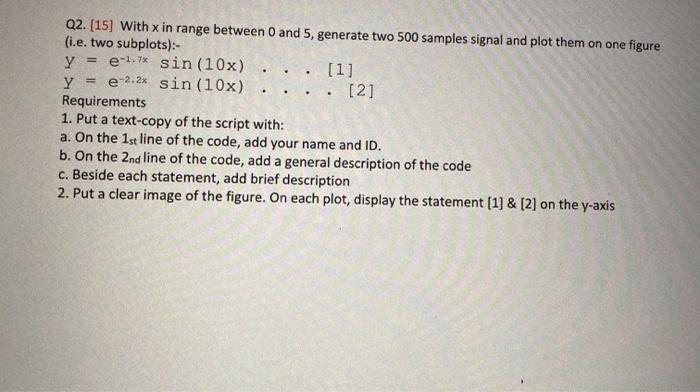
image text in transcribed
= . . . . Q2. [15] With x in range between 0 and 5, generate two 500 samples signal and plot them on one figure (i.e. two subplots):- e-1.7* sin(10x) [1] y = -2.2* sin (10x) . . [2] Requirements 1. Put a text-copy of the script with: a. On the 1st line of the code, add your name and ID. b. On the 2nd line of the code, add a general description of the code c. Beside each statement, add brief description 2. Put a clear image of the figure. On each plot, display the statement [1] & [2] on the y-axis

Step by Step Solution

There are 3 Steps involved in it

Step: 1

blur-text-image

Get Instant Access to Expert-Tailored Solutions

See step-by-step solutions with expert insights and AI powered tools for academic success

Step: 2

blur-text-image_step_2

Step: 3

blur-text-image_step3

Ace Your Homework with AI

Get the answers you need in no time with our AI-driven, step-by-step assistance

Get Started

Recommended Textbook for

DB2 11 The Database For Big Data And Analytics

Authors: Cristian Molaro, Surekha Parekh, Terry Purcell, Julian Stuhler

1st Edition

ISBN: 1583473858, 978-1583473856

More Books

Students also viewed these Databases questions

Question

Repeat Problem 3.43 for the contour shown in Fig. P3.43 (b)

Answered: 1 week ago

Question

What's the difference between Misrepresentation and Fraud?

Answered: 1 week ago