Answered step by step
Verified Expert Solution
Link Copied!

Question

1 Approved Answer

Q2. (20 points) Given the following data, calculate the five-year moving averages for years 6 through 10 by filling in the table below. Year 1

Q2. (20 points) Given the following data, calculate the five-year moving averages for years 6 through 10 by filling in the table below. Year 1 2 Year 1 2 3 4 5 6 7 8 3 4 5 6 7 8 9 9 10 Demand 5-Year Moving Ave. 74 90 59 91 140 98 110 123 Demand 74 90 59 91 140 98 110 123 99 99
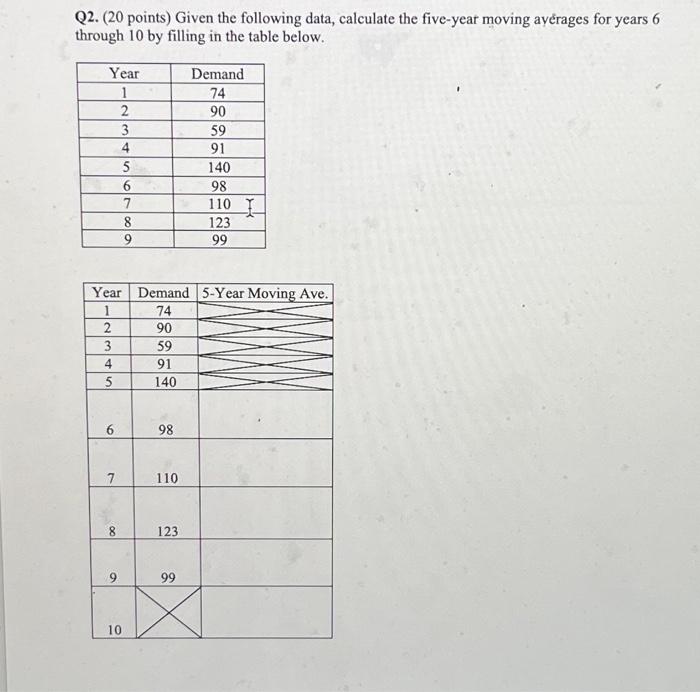
image text in transcribed
Q2. (20 points) Given the following data, calculate the five-yeat moving ayerrages for years 6 through 10 by filling in the table below

Step by Step Solution

There are 3 Steps involved in it

Step: 1

blur-text-image

Get Instant Access to Expert-Tailored Solutions

See step-by-step solutions with expert insights and AI powered tools for academic success

Step: 2

blur-text-image_2

Step: 3

blur-text-image_3

Ace Your Homework with AI

Get the answers you need in no time with our AI-driven, step-by-step assistance

Get Started

Recommended Textbook for

Operations Management Sustainability And Supply Chain Management

Authors: Jay Heizer, Barry Render, Chuck Munson

14th Edition

0137476442, 978-0137476442

More Books

Students also viewed these General Management questions

Question

First U.S.Dollar printed?

Answered: 1 week ago

Question

Who was the confederate president during the civil war ?

Answered: 1 week ago

Question

The emancipation proclamation issued?

Answered: 1 week ago

Question

What war was declared by James Madison ?

Answered: 1 week ago

Question

Americas first sub way system open ?

Answered: 1 week ago