Answered step by step
Verified Expert Solution
Question
1 Approved Answer
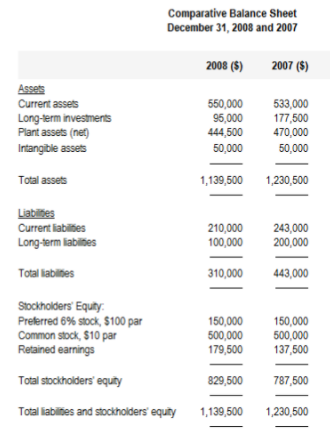
Q2: Analyze the financial status of a company (e.g., liquidity, solvency, profitability) by using horizontal and . You can enter your percentages to the right
Q2: Analyze the financial status of a company (e.g., liquidity, solvency, profitability) by using horizontal and . You can enter your percentages to the right of and the percentages

Q3: Research and calculate the performance of the above business using ratios for the above business. Briefly comment on this figure
-
Liquidity ( 3 marks )
-
Solvency (3 marks )
-
Profitability (3 marks)
Comparative Balance Sheet December 31, 2008 and 2007 2008 (5) 2007 ($) Assets Current assets Long-term investments Plant assets (net) Intangible assets 550,000 95,000 444,500 50,000 533,000 177,500 470,000 50,000 Total assets 1,139,500 1,230,500 Liabilites Current liabilities Long-term liabilities 210,000 100,000 243,000 200,000 Total liabilities 310,000 443,000 Stockholders' Equty Preferred 6% stock, $100 par Common stock, $10 par Retained earnings 150,000 500,000 179,500 150,000 500,000 137,500 Total stockholders' equity 829,500 787,500 Total liabilities and stockholders' equity 1,139,500 1,230,500
Step by Step Solution
There are 3 Steps involved in it
Step: 1

Get Instant Access to Expert-Tailored Solutions
See step-by-step solutions with expert insights and AI powered tools for academic success
Step: 2

Step: 3

Ace Your Homework with AI
Get the answers you need in no time with our AI-driven, step-by-step assistance
Get Started


