

Answered step by step
Verified Expert Solution
Question
1 Approved Answer
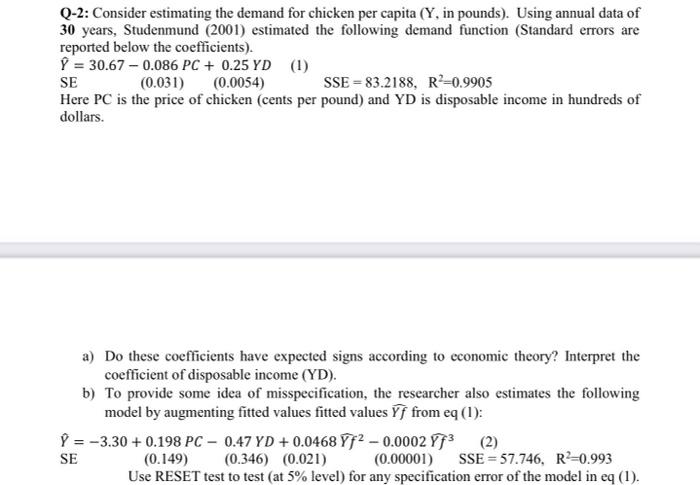
Q-2: Consider estimating the demand for chicken per capita (Y, in pounds). Using annual data of 30 years, Studenmund (2001) estimated the following demand function
Step by Step Solution
There are 3 Steps involved in it
Step: 1

Get Instant Access to Expert-Tailored Solutions
See step-by-step solutions with expert insights and AI powered tools for academic success
Step: 2

Step: 3
Ace Your Homework with AI
Get the answers you need in no time with our AI-driven, step-by-step assistance
Get Started
Applied Econometric Time Series
Authors: Walter Enders
4th Edition
1118808568, 9781118808566