

Question: Q2. Step 1.10 Now plot the following carrier waves s(t) and b(t). Place both plots onto a single graph as you did in steps 1.8
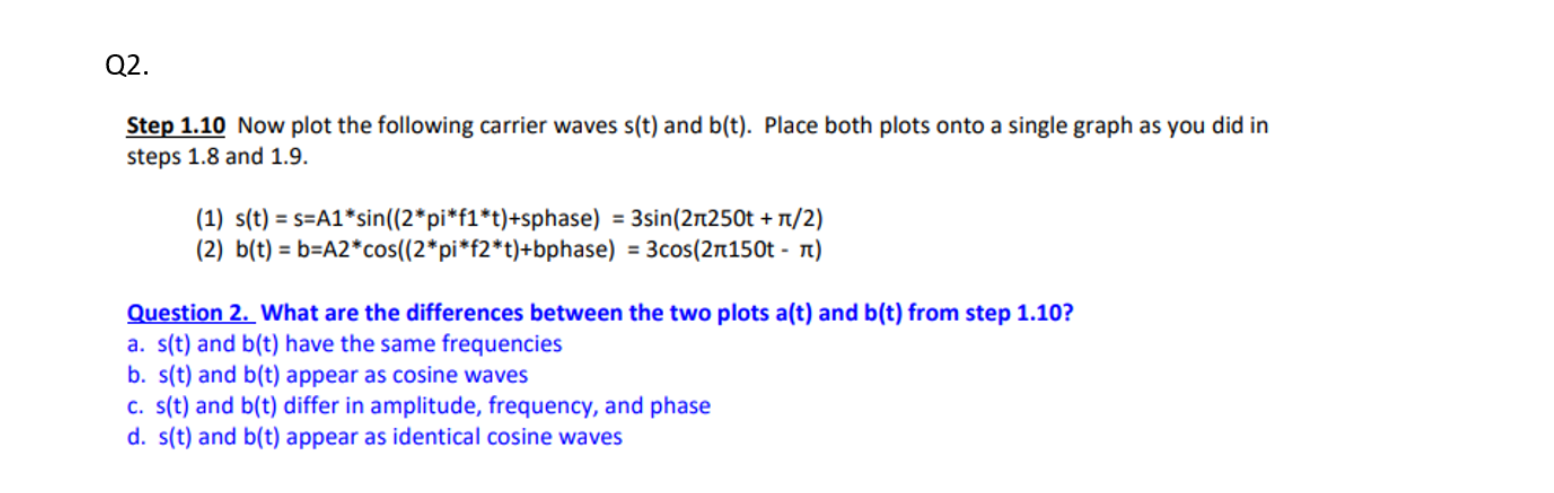
Q2. Step 1.10 Now plot the following carrier waves s(t) and b(t). Place both plots onto a single graph as you did in steps 1.8 and 1.9. (1) s(t) = s=A1*sin((2*pi*f1*t)+sphase) = 3 sin(211250t + 1/2) (2) b(t) = b=A2*cos((2*pi*f2*t)+bphase) = 3 cos(21150t - 1) Question 2. What are the differences between the two plots a(t) and b(t) from step 1.10? a. s(t) and b(t) have the same frequencies b. s(t) and b(t) appear as cosine waves c. s(t) and b(t) differ in amplitude, frequency, and phase d. s(t) and b(t) appear as identical cosine waves
Step by Step Solution
There are 3 Steps involved in it
1 Expert Approved Answer
Step: 1 Unlock

Question Has Been Solved by an Expert!
Get step-by-step solutions from verified subject matter experts
Step: 2 Unlock
Step: 3 Unlock