

Answered step by step
Verified Expert Solution
Question
1 Approved Answer
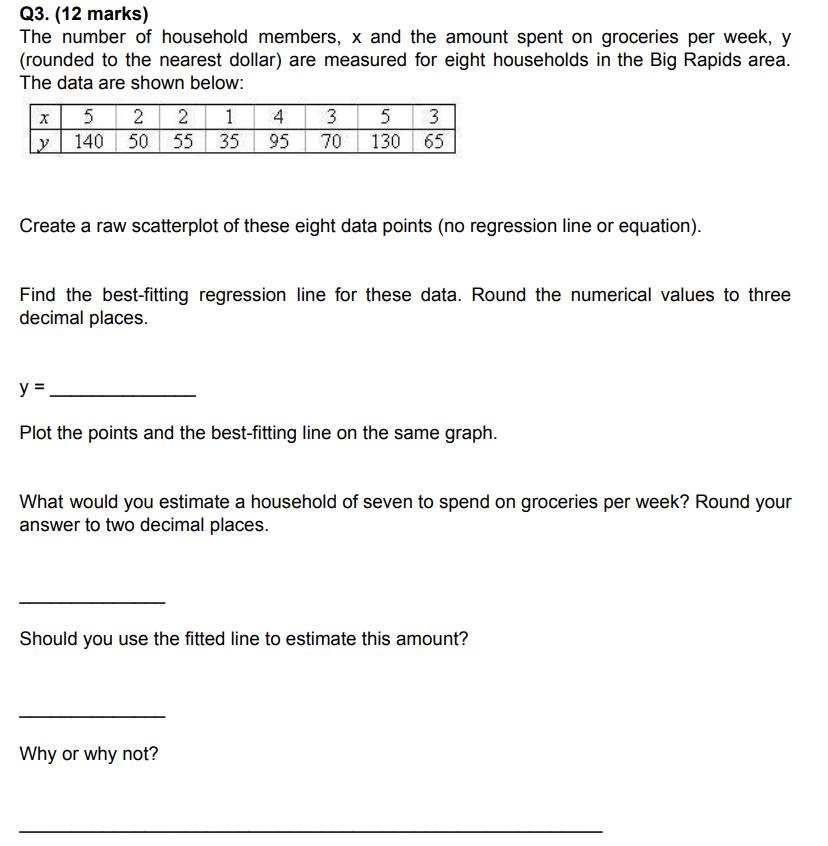
Q3. (12 marks) The number of household members, x and the amount spent on groceries per week, y (rounded to the nearest dollar) are measured
Step by Step Solution
There are 3 Steps involved in it
Step: 1

Get Instant Access to Expert-Tailored Solutions
See step-by-step solutions with expert insights and AI powered tools for academic success
Step: 2

Step: 3
Ace Your Homework with AI
Get the answers you need in no time with our AI-driven, step-by-step assistance
Get Started
Intermediate Algebra
Authors: Marvin L Bittinger
11th Edition
0321968395, 9780321968395