Answered step by step
Verified Expert Solution
Question
1 Approved Answer
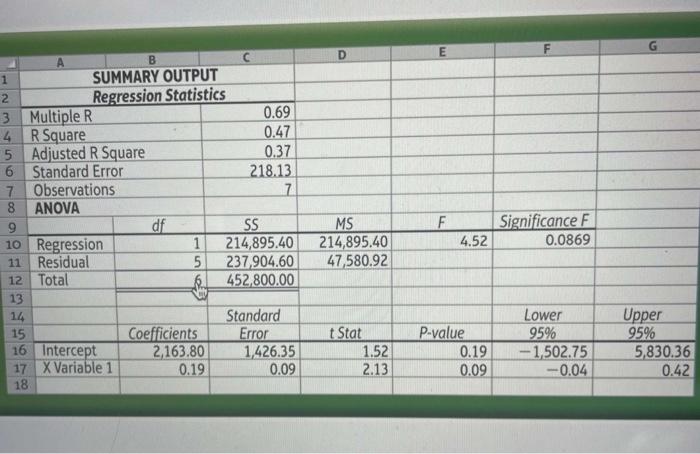
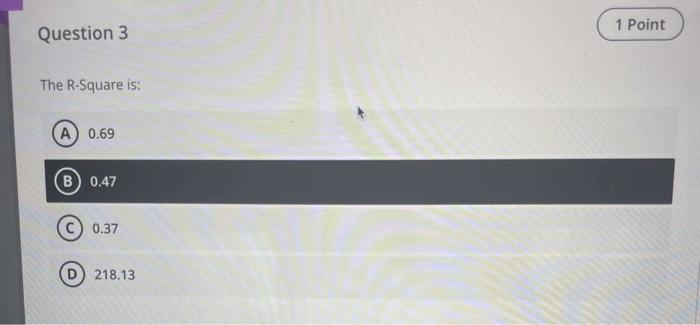
Q3&4 pls 218.13 The R-Square represents the Goodness of Fit-that is, how well the regression line would fit the data points. Based on the value
Q3&4 pls 


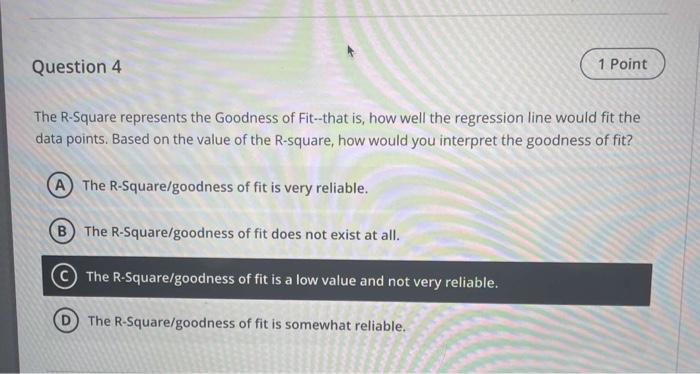
218.13 The R-Square represents the Goodness of Fit-that is, how well the regression line would fit the data points. Based on the value of the R-square, how would you interpret the goodness of fit? The R-Square/goodness of fit is very reliable. The R-Square/goodness of fit does not exist at all. The R-Square/goodness of fit is a low value and not very reliable. The R-Square/goodness of fit is somewhat reliable 


Step by Step Solution
There are 3 Steps involved in it
Step: 1

Get Instant Access to Expert-Tailored Solutions
See step-by-step solutions with expert insights and AI powered tools for academic success
Step: 2

Step: 3

Ace Your Homework with AI
Get the answers you need in no time with our AI-driven, step-by-step assistance
Get Started


