

Answered step by step
Verified Expert Solution
Question
1 Approved Answer
Q4. Show how much savings, if any, BHP will be able to make if it used the swap. EXHIBITI Income statement for BHP as of
Q4. Show how much savings, if any, BHP will be able to make if it used the swap.
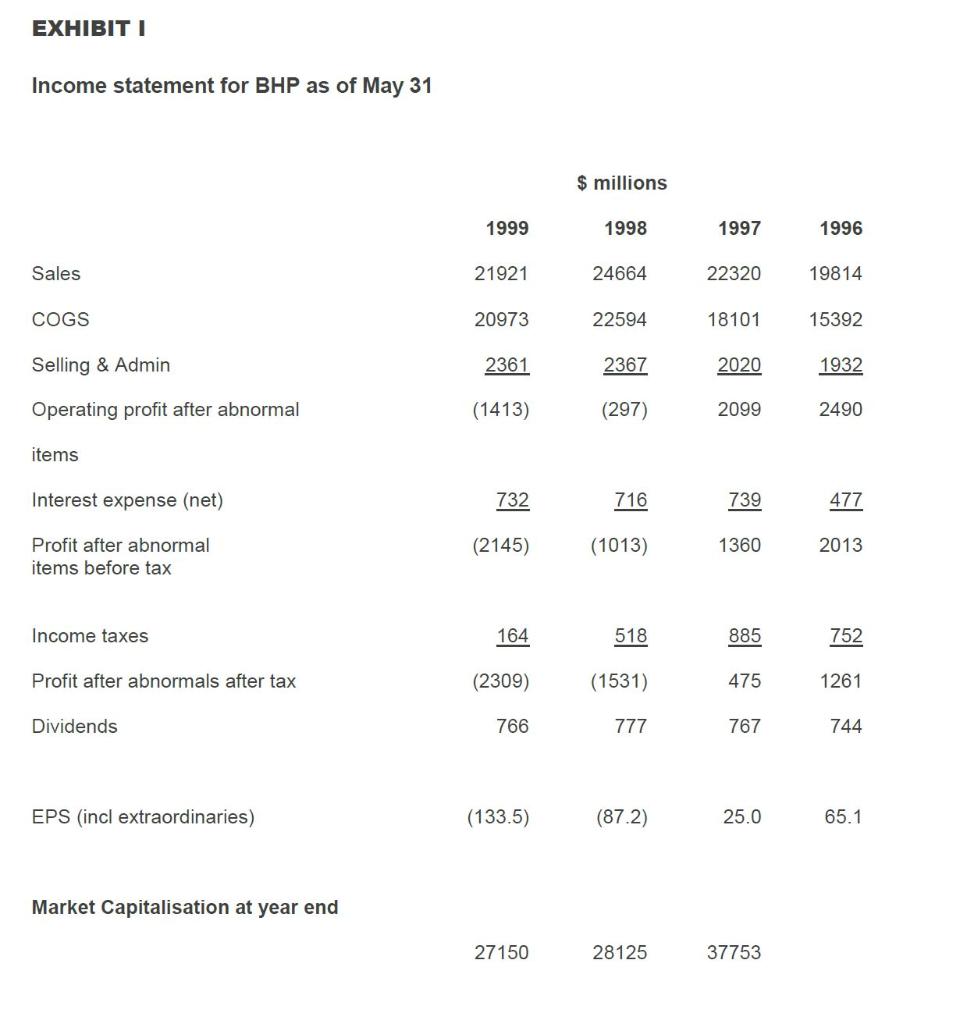
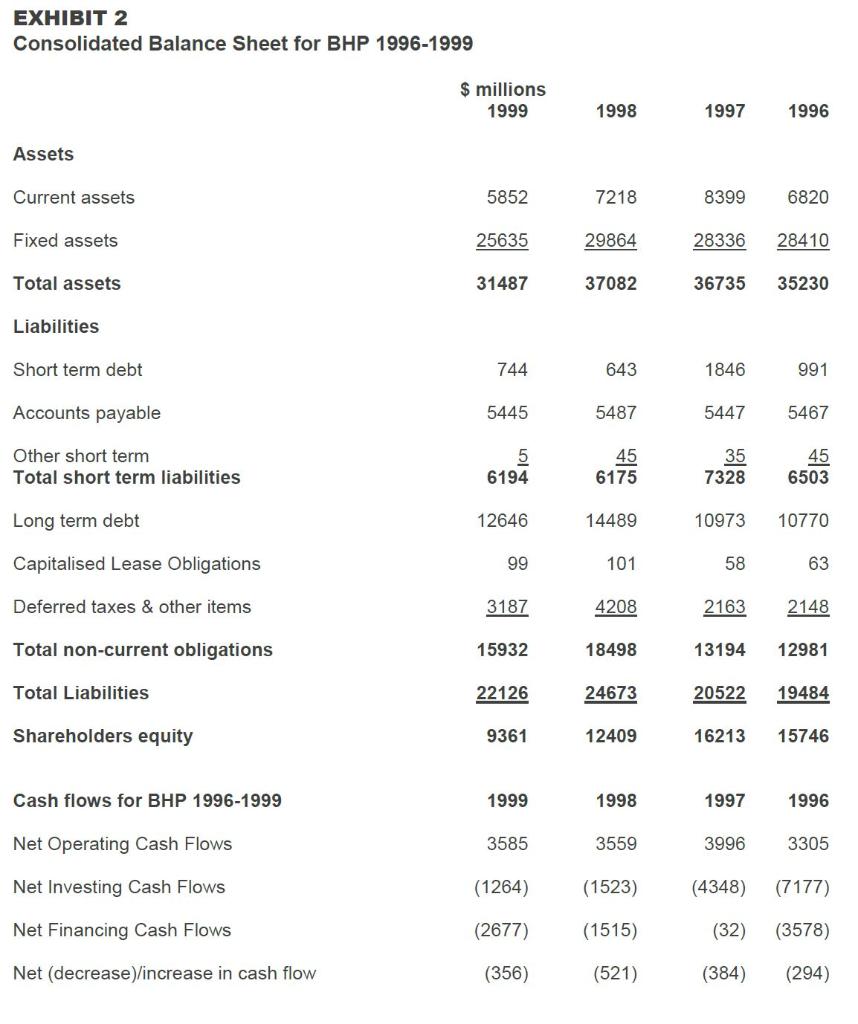
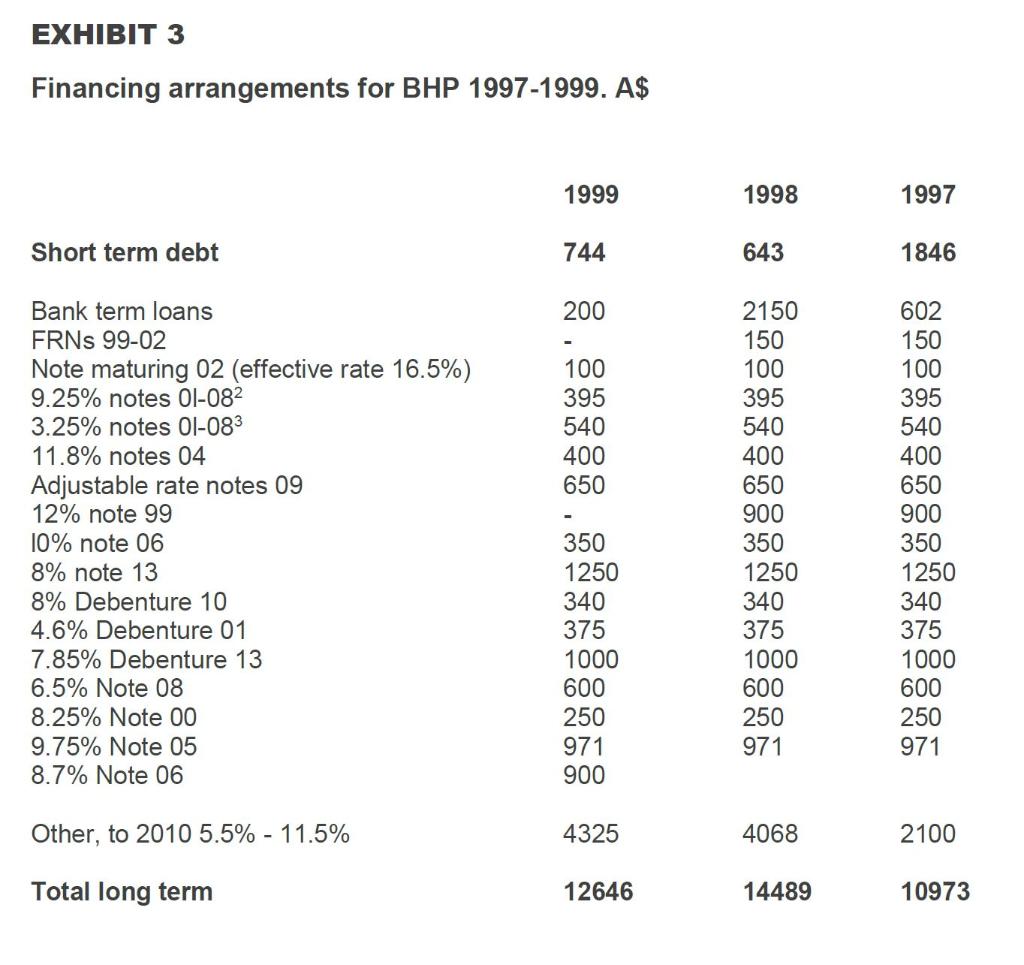
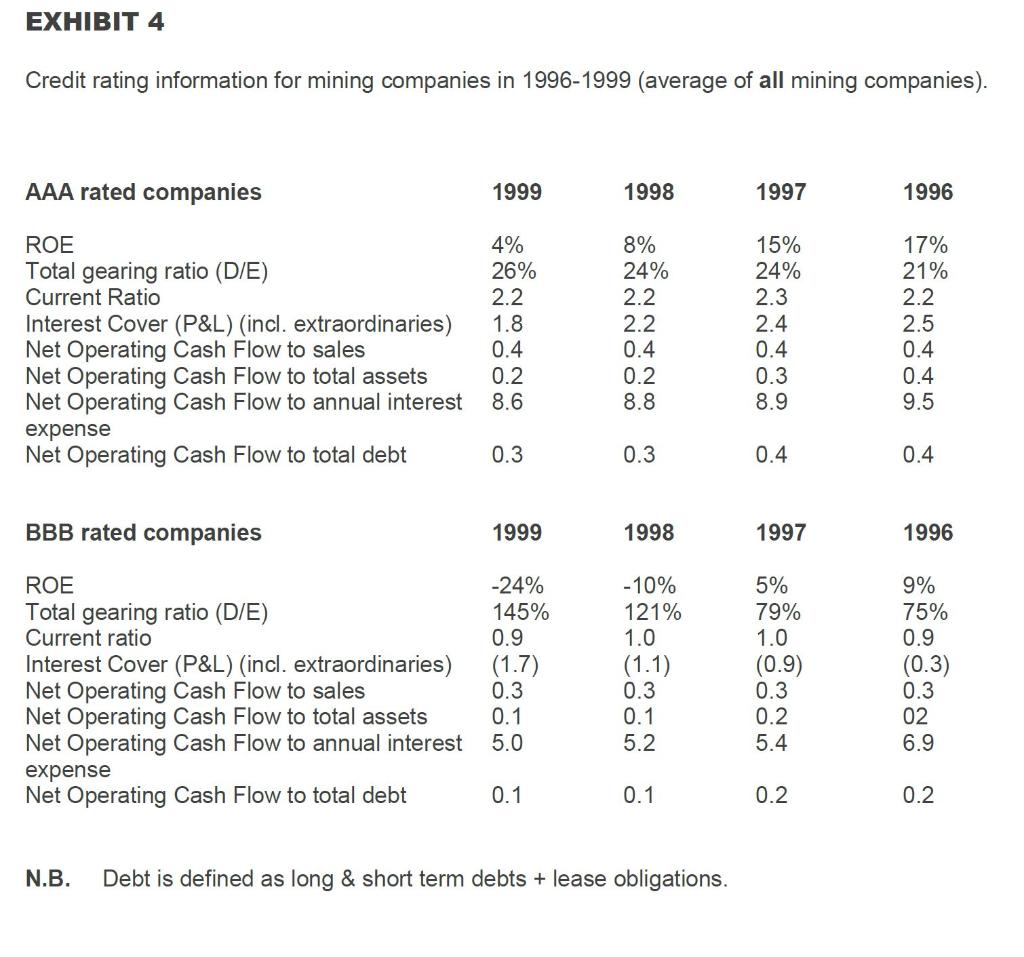
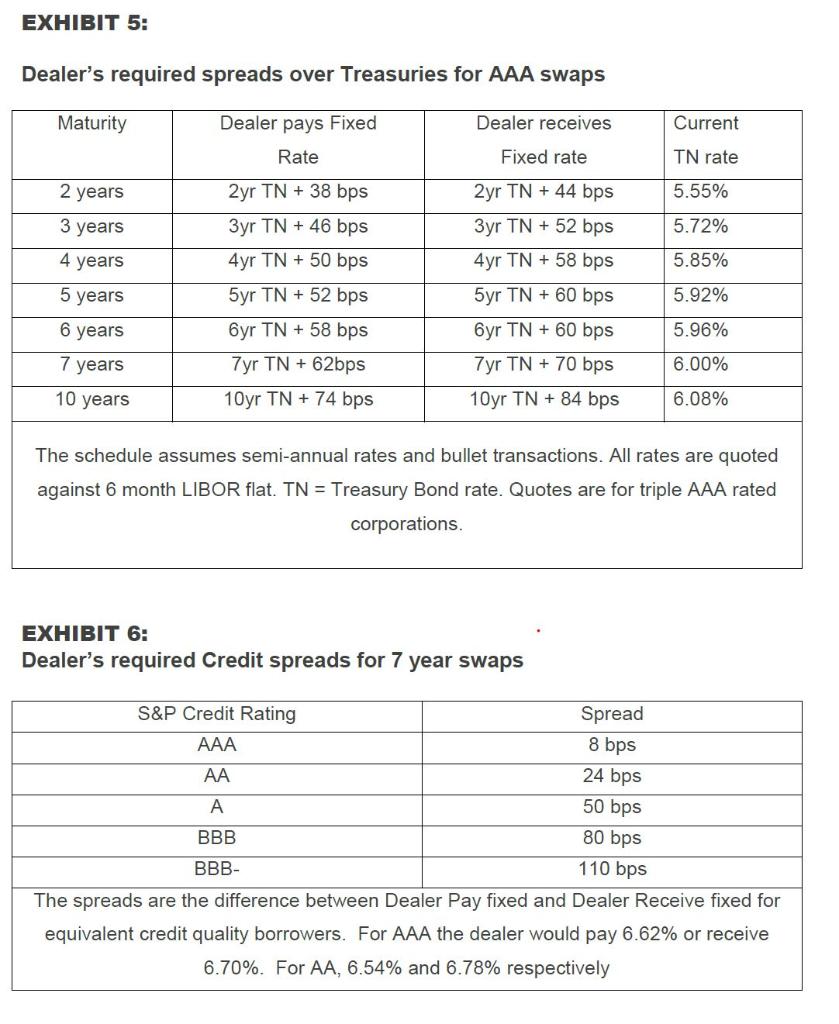
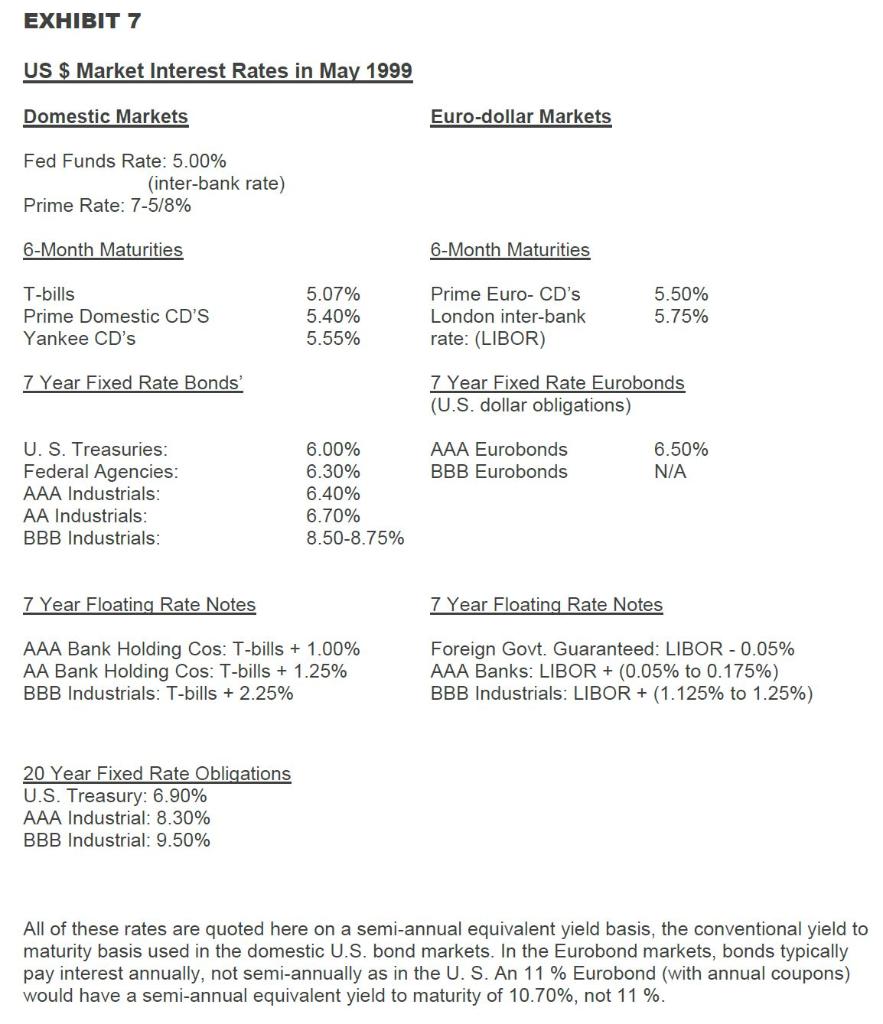
EXHIBITI Income statement for BHP as of May 31 $ millions 1999 1998 1997 1996 Sales 21921 24664 22320 19814 COGS 20973 22594 18101 15392 Selling & Admin 2361 2367 2020 1932 Operating profit after abnormal (1413) (297) 2099 2490 items Interest expense (net) 732 716 739 477 (2145) Profit after abnormal items before tax (1013) 1360 2013 Income taxes 164 518 885 752 Profit after abnormals after tax (2309) (1531) 475 1261 Dividends 766 777 767 744 EPS (incl extraordinaries) (133.5) (87.2) 25.0 65.1 Market Capitalisation at year end 27150 28125 37753 EXHIBIT 2 Consolidated Balance Sheet for BHP 1996-1999 $ millions 1999 1998 1997 1996 Assets Current assets 5852 7218 8399 6820 Fixed assets 25635 29864 28336 28410 Total assets 31487 37082 36735 35230 Liabilities Short term debt 744 643 1846 991 Accounts payable 5445 5487 5447 5467 Other short term Total short term liabilities 5 6194 45 6175 35 7328 45 6503 Long term debt 12646 14489 10973 10770 Capitalised Lease Obligations 99 101 58 63 Deferred taxes & other items 3187 4208 2163 2148 Total non-current obligations 15932 18498 13194 12981 Total Liabilities 22126 24673 20522 19484 Shareholders equity 9361 12409 16213 15746 Cash flows for BHP 1996-1999 1999 1998 1997 1996 Net Operating Cash Flows 3585 3559 3996 3305 Net Investing Cash Flows (1264) (1523) (4348) (7177) Net Financing Cash Flows (2677) (1515) (32) (3578) Net (decrease)/increase in cash flow (356) (521) (384) (294) EXHIBIT 3 Financing arrangements for BHP 1997-1999. A$ 1999 1998 1997 Short term debt 744 643 1846 200 100 395 540 400 650 Bank term loans FRNs 99-02 Note maturing 02 (effective rate 16.5%) 9.25% notes Ol-082 3.25% notes Ol-083 11.8% notes 04 Adjustable rate notes 09 12% note 99 10% note 06 8% note 13 8% Debenture 10 4.6% Debenture 01 7.85% Debenture 13 6.5% Note 08 8.25% Note 00 9.75% Note 05 8.7% Note 06 2150 150 100 395 540 400 650 900 350 1250 340 375 1000 600 250 971 602 150 100 395 540 400 650 900 350 1250 340 375 1000 600 250 971 350 1250 340 375 1000 600 250 971 900 Other, to 2010 5.5% - 11.5% 4325 4068 2100 Total long term 12646 14489 10973 EXHIBIT 4 Credit rating information for mining companies in 1996-1999 (average of all mining companies). AAA rated companies 1999 1998 1997 1996 ROE Total gearing ratio (D/E) Current Ratio Interest Cover (P&L) (incl. extraordinaries) Net Operating Cash Flow to sales Net Operating Cash Flow to total assets Net Operating Cash Flow to annual interest expense Net Operating Cash Flow to total debt FOO 00 4% 26% 2.2 1.8 0.4 0.2 8.6 ON OON 8% 24% 2.2 2.2 0.4 0.2 8.8 15% 24% 2.3 2.4 0.4 0.3 8.9 17% 21% 2.2 2.5 0.4 0.4 9.5 0.3 0.3 0.4 0.4 BBB rated companies 1999 1998 1997 1996 ROE Total gearing ratio (D/E) Current ratio Interest Cover (P&L) (incl. extraordinaries) Net Operating Cash Flow to sales Net Operating Cash Flow to total assets Net Operating Cash Flow to annual interest expense Net Operating Cash Flow to total debt -24% 145% 0.9 (1.7) 0.3 -10% 121% 1.0 (1.1) 0.3 5% 79% 1.0 (0.9) 0.3 0.2 5.4 9% 75% 0.9 (0.3) 0.3 02 6.9 0.1 0.1 5.0 5.2 0.1 0.1 0.2 0.2 N.B. Debt is defined as long & short term debts + lease obligations. EXHIBIT 5: Dealer's required spreads over Treasuries for AAA swaps Maturity Dealer pays Fixed Dealer receives Current Rate Fixed rate TN rate 5.55% 2 years 3 years 5.72% 4 years 5.85% 5 years 2yr TN + 38 bps 3yr TN + 46 bps 4yr TN + 50 bps 5yr TN + 52 bps 6yr TN + 58 bps 7yr TN +62bps 10yr TN + 74 bps 2yr TN + 44 bps 3yr TN + 52 bps 4yr TN + 58 bps 5yr TN + 60 bps 6yr TN + 60 bps 7yr TN + 70 bps 10yr TN + 84 bps 5.92% 5.96% 6 years 7 years 6.00% 10 years 6.08% The schedule assumes semi-annual rates and bullet transactions. All rates are quoted against 6 month LIBOR flat. TN = Treasury Bond rate. Quotes are for triple AAA rated corporations. EXHIBIT 6: Dealer's required Credit spreads for 7 year swaps S&P Credit Rating Spread AAA 8 bps 24 bps 50 bps BBB 80 bps BBB- 110 bps The spreads are the difference between Dealer Pay fixed and Dealer Receive fixed for equivalent credit quality borrowers. For AAA the dealer would pay 6.62% or receive 6.70%. For AA, 6.54% and 6.78% respectively EXHIBIT 7 US $ Market Interest Rates in May 1999 Domestic Markets Euro-dollar Markets Fed Funds Rate: 5.00% (inter-bank rate) Prime Rate: 7-5/8% 6-Month Maturities 6-Month Maturities T-bills Prime Domestic CD'S Yankee CD's 5.07% 5.40% 5.55% Prime Euro-CD's London inter-bank rate: (LIBOR) 5.50% 5.75% 7 Year Fixed Rate Bonds' 7 Year Fixed Rate Eurobonds (U.S. dollar obligations) AAA Eurobonds BBB Eurobonds 6.50% N/A U.S. Treasuries: Federal Agencies: AAA Industrials: AA Industrials: BBB Industrials: 6.00% 6.30% 6.40% 6.70% 8.50-8.75% 7 Year Floating Rate Notes 7 Year Floating Rate Notes AAA Bank Holding Cos: T-bills + 1.00% AA Bank Holding Cos: T-bills + 1.25% BBB Industrials: T-bills +2.25% Foreign Govt. Guaranteed: LIBOR -0.05% AAA Banks: LIBOR + (0.05% to 0.175%) BBB Industrials: LIBOR + (1.125% to 1.25%) 20 Year Fixed Rate Obligations U.S. Treasury: 6.90% AAA Industrial: 8.30% BBB Industrial: 9.50% All of these rates are quoted here on a semi-annual equivalent yield basis, the conventional yield to maturity basis used in the domestic U.S. bond markets. In the Eurobond markets, bonds typically pay interest annually, not semi-annually as in the U. S. An 11 % Eurobond (with annual coupons) would have a semi-annual equivalent yield to maturity of 10.70%, not 11 %. EXHIBITI Income statement for BHP as of May 31 $ millions 1999 1998 1997 1996 Sales 21921 24664 22320 19814 COGS 20973 22594 18101 15392 Selling & Admin 2361 2367 2020 1932 Operating profit after abnormal (1413) (297) 2099 2490 items Interest expense (net) 732 716 739 477 (2145) Profit after abnormal items before tax (1013) 1360 2013 Income taxes 164 518 885 752 Profit after abnormals after tax (2309) (1531) 475 1261 Dividends 766 777 767 744 EPS (incl extraordinaries) (133.5) (87.2) 25.0 65.1 Market Capitalisation at year end 27150 28125 37753 EXHIBIT 2 Consolidated Balance Sheet for BHP 1996-1999 $ millions 1999 1998 1997 1996 Assets Current assets 5852 7218 8399 6820 Fixed assets 25635 29864 28336 28410 Total assets 31487 37082 36735 35230 Liabilities Short term debt 744 643 1846 991 Accounts payable 5445 5487 5447 5467 Other short term Total short term liabilities 5 6194 45 6175 35 7328 45 6503 Long term debt 12646 14489 10973 10770 Capitalised Lease Obligations 99 101 58 63 Deferred taxes & other items 3187 4208 2163 2148 Total non-current obligations 15932 18498 13194 12981 Total Liabilities 22126 24673 20522 19484 Shareholders equity 9361 12409 16213 15746 Cash flows for BHP 1996-1999 1999 1998 1997 1996 Net Operating Cash Flows 3585 3559 3996 3305 Net Investing Cash Flows (1264) (1523) (4348) (7177) Net Financing Cash Flows (2677) (1515) (32) (3578) Net (decrease)/increase in cash flow (356) (521) (384) (294) EXHIBIT 3 Financing arrangements for BHP 1997-1999. A$ 1999 1998 1997 Short term debt 744 643 1846 200 100 395 540 400 650 Bank term loans FRNs 99-02 Note maturing 02 (effective rate 16.5%) 9.25% notes Ol-082 3.25% notes Ol-083 11.8% notes 04 Adjustable rate notes 09 12% note 99 10% note 06 8% note 13 8% Debenture 10 4.6% Debenture 01 7.85% Debenture 13 6.5% Note 08 8.25% Note 00 9.75% Note 05 8.7% Note 06 2150 150 100 395 540 400 650 900 350 1250 340 375 1000 600 250 971 602 150 100 395 540 400 650 900 350 1250 340 375 1000 600 250 971 350 1250 340 375 1000 600 250 971 900 Other, to 2010 5.5% - 11.5% 4325 4068 2100 Total long term 12646 14489 10973 EXHIBIT 4 Credit rating information for mining companies in 1996-1999 (average of all mining companies). AAA rated companies 1999 1998 1997 1996 ROE Total gearing ratio (D/E) Current Ratio Interest Cover (P&L) (incl. extraordinaries) Net Operating Cash Flow to sales Net Operating Cash Flow to total assets Net Operating Cash Flow to annual interest expense Net Operating Cash Flow to total debt FOO 00 4% 26% 2.2 1.8 0.4 0.2 8.6 ON OON 8% 24% 2.2 2.2 0.4 0.2 8.8 15% 24% 2.3 2.4 0.4 0.3 8.9 17% 21% 2.2 2.5 0.4 0.4 9.5 0.3 0.3 0.4 0.4 BBB rated companies 1999 1998 1997 1996 ROE Total gearing ratio (D/E) Current ratio Interest Cover (P&L) (incl. extraordinaries) Net Operating Cash Flow to sales Net Operating Cash Flow to total assets Net Operating Cash Flow to annual interest expense Net Operating Cash Flow to total debt -24% 145% 0.9 (1.7) 0.3 -10% 121% 1.0 (1.1) 0.3 5% 79% 1.0 (0.9) 0.3 0.2 5.4 9% 75% 0.9 (0.3) 0.3 02 6.9 0.1 0.1 5.0 5.2 0.1 0.1 0.2 0.2 N.B. Debt is defined as long & short term debts + lease obligations. EXHIBIT 5: Dealer's required spreads over Treasuries for AAA swaps Maturity Dealer pays Fixed Dealer receives Current Rate Fixed rate TN rate 5.55% 2 years 3 years 5.72% 4 years 5.85% 5 years 2yr TN + 38 bps 3yr TN + 46 bps 4yr TN + 50 bps 5yr TN + 52 bps 6yr TN + 58 bps 7yr TN +62bps 10yr TN + 74 bps 2yr TN + 44 bps 3yr TN + 52 bps 4yr TN + 58 bps 5yr TN + 60 bps 6yr TN + 60 bps 7yr TN + 70 bps 10yr TN + 84 bps 5.92% 5.96% 6 years 7 years 6.00% 10 years 6.08% The schedule assumes semi-annual rates and bullet transactions. All rates are quoted against 6 month LIBOR flat. TN = Treasury Bond rate. Quotes are for triple AAA rated corporations. EXHIBIT 6: Dealer's required Credit spreads for 7 year swaps S&P Credit Rating Spread AAA 8 bps 24 bps 50 bps BBB 80 bps BBB- 110 bps The spreads are the difference between Dealer Pay fixed and Dealer Receive fixed for equivalent credit quality borrowers. For AAA the dealer would pay 6.62% or receive 6.70%. For AA, 6.54% and 6.78% respectively EXHIBIT 7 US $ Market Interest Rates in May 1999 Domestic Markets Euro-dollar Markets Fed Funds Rate: 5.00% (inter-bank rate) Prime Rate: 7-5/8% 6-Month Maturities 6-Month Maturities T-bills Prime Domestic CD'S Yankee CD's 5.07% 5.40% 5.55% Prime Euro-CD's London inter-bank rate: (LIBOR) 5.50% 5.75% 7 Year Fixed Rate Bonds' 7 Year Fixed Rate Eurobonds (U.S. dollar obligations) AAA Eurobonds BBB Eurobonds 6.50% N/A U.S. Treasuries: Federal Agencies: AAA Industrials: AA Industrials: BBB Industrials: 6.00% 6.30% 6.40% 6.70% 8.50-8.75% 7 Year Floating Rate Notes 7 Year Floating Rate Notes AAA Bank Holding Cos: T-bills + 1.00% AA Bank Holding Cos: T-bills + 1.25% BBB Industrials: T-bills +2.25% Foreign Govt. Guaranteed: LIBOR -0.05% AAA Banks: LIBOR + (0.05% to 0.175%) BBB Industrials: LIBOR + (1.125% to 1.25%) 20 Year Fixed Rate Obligations U.S. Treasury: 6.90% AAA Industrial: 8.30% BBB Industrial: 9.50% All of these rates are quoted here on a semi-annual equivalent yield basis, the conventional yield to maturity basis used in the domestic U.S. bond markets. In the Eurobond markets, bonds typically pay interest annually, not semi-annually as in the U. S. An 11 % Eurobond (with annual coupons) would have a semi-annual equivalent yield to maturity of 10.70%, not 11 %
Step by Step Solution
There are 3 Steps involved in it
Step: 1

Get Instant Access to Expert-Tailored Solutions
See step-by-step solutions with expert insights and AI powered tools for academic success
Step: 2

Step: 3
Ace Your Homework with AI
Get the answers you need in no time with our AI-driven, step-by-step assistance
Get Started
The International Handbook Of Public Financial Management
Authors: Richard Allen, Richard Hemming, B. Potter
1st Edition
1137574895, 978-1137574893