

Answered step by step
Verified Expert Solution
Question
1 Approved Answer
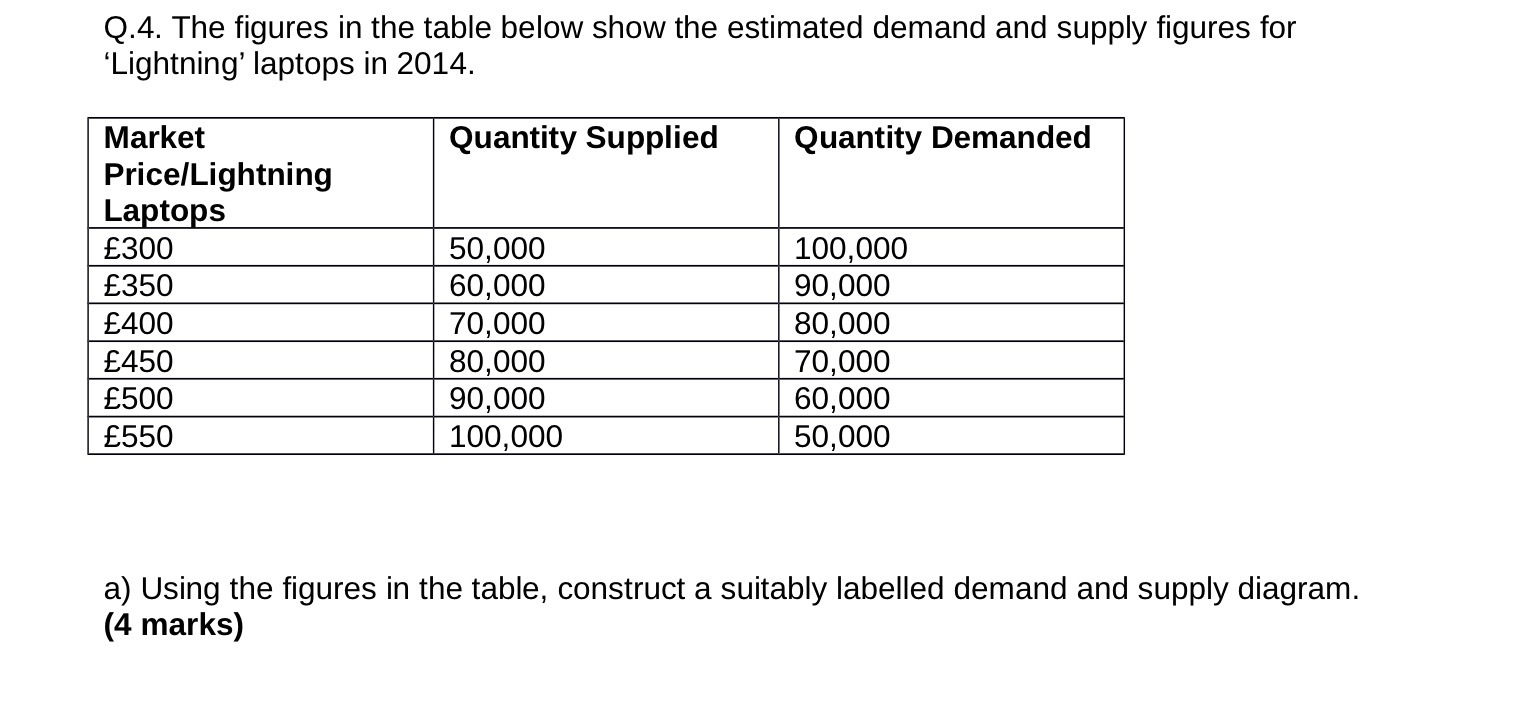
Q.4. The figures in the table below show the estimated demand and supply figures for 'Lightning' laptops in 2014. Market Quantity Supplied Quantity Demanded PricelLightning
Step by Step Solution
There are 3 Steps involved in it
Step: 1

Get Instant Access to Expert-Tailored Solutions
See step-by-step solutions with expert insights and AI powered tools for academic success
Step: 2

Step: 3
Ace Your Homework with AI
Get the answers you need in no time with our AI-driven, step-by-step assistance
Get Started
Business Statistics for Contemporary Decision Making
Authors: Ken Black
6th Edition
978-0470409015, 9780470559062, 470409010, 470559063, 978-0470910184