

Answered step by step
Verified Expert Solution
Question
1 Approved Answer
Q4. Using the information of the attached Balance Sheet and Profit and Loss Statement (Attached as follows), Calculate the following ratio 1) Net Working Capital
Q4. Using the information of the attached Balance Sheet and Profit and Loss Statement (Attached as follows), Calculate the following ratio 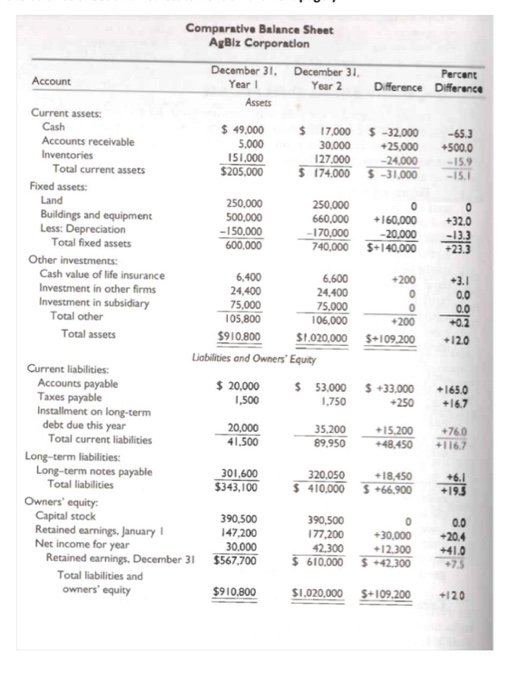
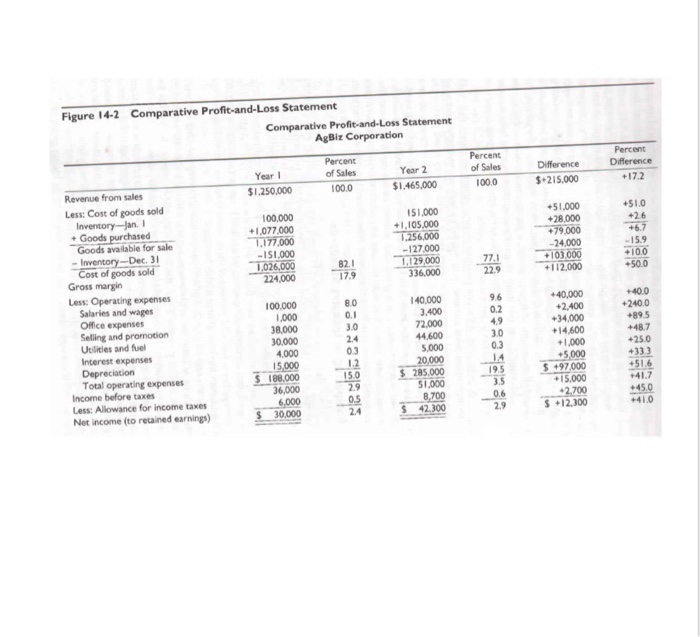
Comparative Balance Sheet AgBiz Corporation December 31. December 31 Percent Account Year Year 2 Difference Difference Assets Current assets: Cash $ 49,000 $ 17.000 $ -32.000 -65.3 Accounts receivable 5,000 30,000 +25,000 +500.0 Inventories 151.000 127.000 -24,000 -15.9 Total current assets $205,000 $ 174,000 $-31,000 -15.1 Fixed assets: Land 250,000 250,000 0 Buildings and equipment 500,000 660,000 +160,000 +32.0 Less: Depreciation - 150.000 -170,000 -20,000 Total fixed assets 600,000 740,000 $+140,000 +23 Other investments: Cash value of life insurance 6,400 6.600 -200 3.1 Investment in other firms 24,400 24.400 0 0.0 Investment in subsidiary 75,000 75.000 0 0.0 Total other 105,800 106,000 +0.2 Total assets $910.800 $1.020,000 $+109.200 +12.0 Liabilities and Owners' Equity Current liabilities: Accounts payable $ 20,000 $ 53,000 $33.000 +165.0 Taxes payable 1,500 1,750 +250 +16.7 Installment on long-term debt due this year 20,000 35,200 +15.200 +760 Total current liabilities 41.500 89.950 +48.450 +116.7 Long-term liabilities: Long-term notes payable 301,600 320,050 +18,450 +6.1 Total liabilities $343,100 $ 410,000 5 +66.900 +19.5 Owners' equity Capital stock 390,500 390,500 0 0.0 Retained earnings, January 147,200 177,200 -30,000 -20.4 Net income for year 30.000 42,300 +12,300 +41.0 Retained earnings, December 31 $567,700 $ 610.000 $42.300 Total liabilities and owners' equity $910.800 $1,020,000 $+109.200 +120 *200 Percent of Sales 100.0 Difference $ 215.000 Percent Difference +17.2 +51.0 Figure 14-2 Comparative Profit-and-Loss Statement Comparative Profit-and-Loss Statement AgBiz Corporation Percent Year! of Sales Year 2 Revenue from sales $1.250.000 100.0 $1.465.000 Less: Cost of goods sold Inventory --Jan. 1 100,000 151.000 + Goods purchased +1.077.000 +1,105,000 Goods available for sale 1,177.000 1.256,000 - Inventory-Dec. 31 - 151.000 - 127.000 Cost of goods sold 1,026,000 82.1 1,129,000 Gross margin 224.000 17.9 336.000 Less: Operating expenses Salaries and wages 100.000 80 140,000 Office expenses 1.000 0.1 3.400 Selling and promotion 38.000 3.0 72.000 Utilities and fuel 30,000 2.4 44.600 Interest expenses 4.000 5.000 Depreciation 15.000 1.2 20,000 Total operating expenses $ 188,000 150 $285,000 Income before taxes 36,000 2.9 51,000 Less: Allowance for income taxes 6,000 05 8,700 Net Income (to retained earnings) $ 30,000 24 42.300 51.000 +28,000 +79.000 -24,000 +103.000 +112.000 -6.7 - 15.9 +10.0 50.0 77.1 22.9 96 0.2 4.9 30 0.3 14 195 3.5 0.6 2.9 0.3 +40.0 +240.0 +89.5 48.7 25.0 +33) +40,000 +2.400 +34.000 +14,600 + 1,000 +5000 $ 97,000 +15.000 +2.700 $ 12.300 51.6 41.7 +45.0 +410 1) Net Working Capital (year 1)
= Net working capital (year 2)=
2) Current Ratios in year 1=
Current Ratios in year 2=
Quick Ratios in year 1 =
Quick Ratios in year 2=
Acid Test Ratios in year 1=
Acid Test Ratios in year 2=
3)Debt to Solvency ratios in year 1=
Debt to Solvency ratios in year 2=
Times interest Earned Ratios in year 1 =
Times interest Earned Ratios in year 2=
4) Inventory turn over ratio in year 1 =
Inventory turn over ratio in year 2=
5) The account receivable turnover ratio in year 1 and year 2. (If Credit sale is 10% of the total sales)
The account payable turnover ratio in year 1 and year 2. (If Credit sale is 25% of the goods purchased)
6) Return on invested capital ratio in year 1= Return on invested capital ratio in year 2=
Return on owner's equity ratio in year 1=
Return on owner's equity ratio in year 2=
Profit as a percentage of sales ratio in year 1= Profit as a percentage of sales ratio in year 2=
Step by Step Solution
There are 3 Steps involved in it
Step: 1

Get Instant Access to Expert-Tailored Solutions
See step-by-step solutions with expert insights and AI powered tools for academic success
Step: 2

Step: 3
Ace Your Homework with AI
Get the answers you need in no time with our AI-driven, step-by-step assistance
Get Started
The Evaluation Of An Internal Audit Department The Case Of SOTELMA
Authors: Oumar Bah
1st Edition
6204486039, 978-6204486031