Answered step by step
Verified Expert Solution
Question
1 Approved Answer
Q5) Consider the 4x4 image of Figure Q5 with a gray scale from 0 to 7. We wish to modify the grey scale distribution of
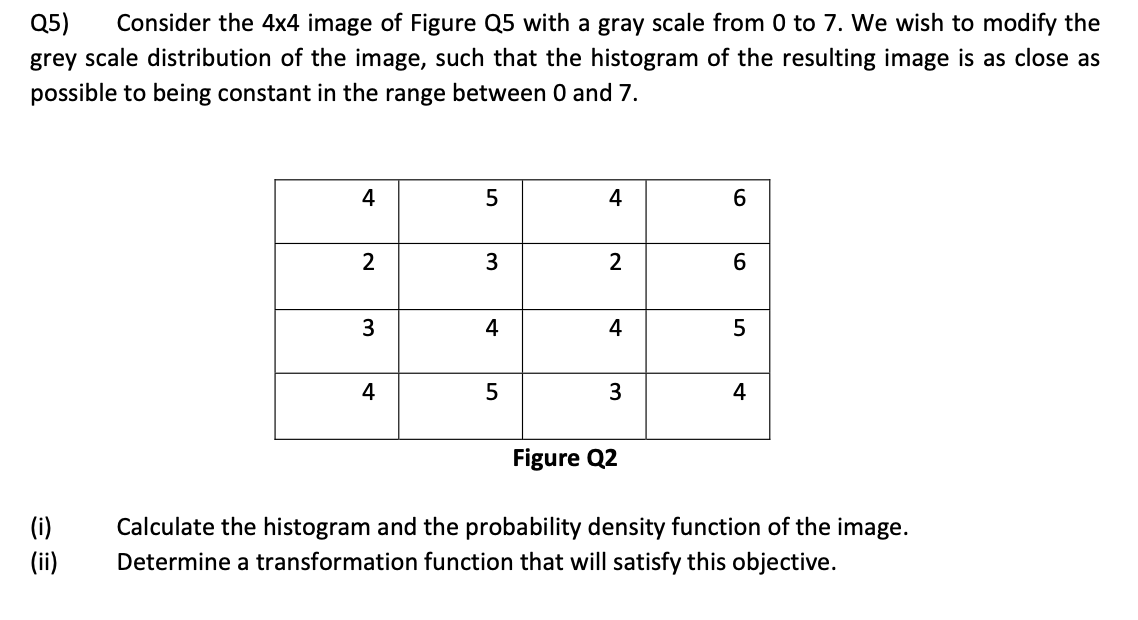
Q5) Consider the 4x4 image of Figure Q5 with a gray scale from 0 to 7. We wish to modify the grey scale distribution of the image, such that the histogram of the resulting image is as close as possible to being constant in the range between 0 and 7. Figure Q2 (i) (ii) Calculate the histogram and the probability density function of the image. Determine a transformation function that will satisfy this objective. (iii) (iv) Use a diagram to show the mapping of grey levels from the original to the resulting scale. Compare the grey level distribution of pixels between the original and the output image. What conclusions can you draw by comparing the original and modified image histograms? Is the objective of the transformation satisfied and why? Q5) Consider the 4x4 image of Figure Q5 with a gray scale from 0 to 7. We wish to modify the grey scale distribution of the image, such that the histogram of the resulting image is as close as possible to being constant in the range between 0 and 7. Figure Q2 (i) (ii) Calculate the histogram and the probability density function of the image. Determine a transformation function that will satisfy this objective. (iii) (iv) Use a diagram to show the mapping of grey levels from the original to the resulting scale. Compare the grey level distribution of pixels between the original and the output image. What conclusions can you draw by comparing the original and modified image histograms? Is the objective of the transformation satisfied and why
Step by Step Solution
There are 3 Steps involved in it
Step: 1
Get Instant Access to Expert-Tailored Solutions
See step-by-step solutions with expert insights and AI powered tools for academic success
Step: 2
Step: 3
Ace Your Homework with AI
Get the answers you need in no time with our AI-driven, step-by-step assistance
Get Started