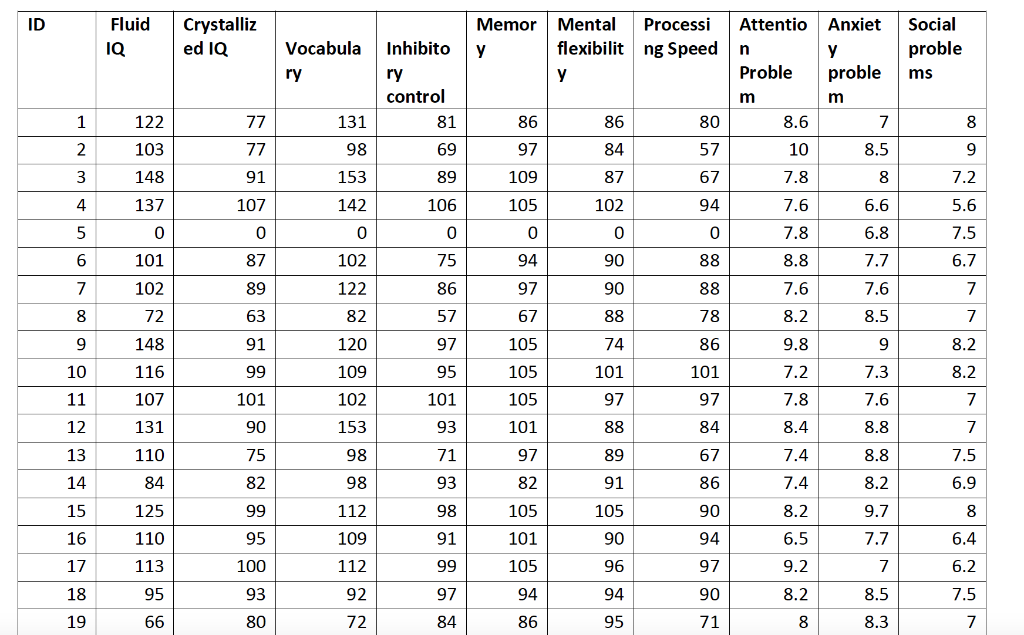
Q5: The following is data collected from 30 participants from 10 attributes, (60 points) Step 1: Please check data quality, do necessary cleaning and/or transformation


Q5: The following is data collected from 30 participants from 10 attributes, (60 points)
Step 1: Please check data quality, do necessary cleaning and/or transformation steps , and explain what you did, and why (15 points) Hint: consider missing, outliers, scaleormalization
Step 2: a) Compute covariance matrix of data among all variables after step1. ( this should be a 10-by-10 matrix) Note: Python Each row of data array represents a variable (5 points),
b) compute the total variance of data = sum of diagonal elements of covariance matrix (5 points),
c) compute correlation (Pearsons correlation) between variable 1 and variable 2 (5 points),
Step 3: perform Principal component analysis (PCA) to generate a number of Principal Components (PCs) capturing >85% of total data variance.
a) Plot percentage of variances of each Principal Components(PC) in a decreasing order (5 points)
b) How many components do you need to capture > 85% total data variance? (5 points)
c) Plot the generated (new) top P PC variables you selected (5 points)
d) Compute the covarion matrix of the P PC variables (this should be P-by-P matrix), and compute the total variance of PCs ( sum of diagonal elements of covariance matrix ), compare this value with the total variance of data in Step2_b, what % variance kept in PCs (5 points),
e) compute correlation (Pearsons correlation) between new variable PC1 and new variable PC2 (5 points),
f) Plot the PC coefficients (or projection direction) of N components you selected (5 points)
Step by Step Solution
There are 3 Steps involved in it
Step: 1

See step-by-step solutions with expert insights and AI powered tools for academic success
Step: 2

Step: 3

Ace Your Homework with AI
Get the answers you need in no time with our AI-driven, step-by-step assistance
Get Started


