Q50 320 Final Project Business Scenario Milestone One Prompt: The Vinho Winery in Lodi, California produces about one million cases of wine a year. It
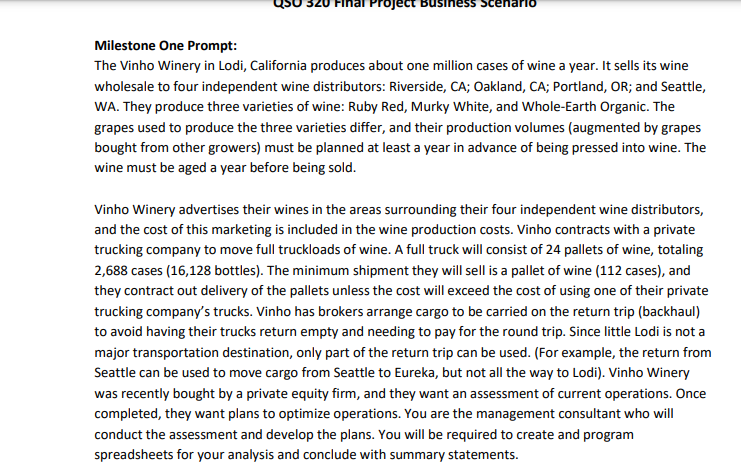
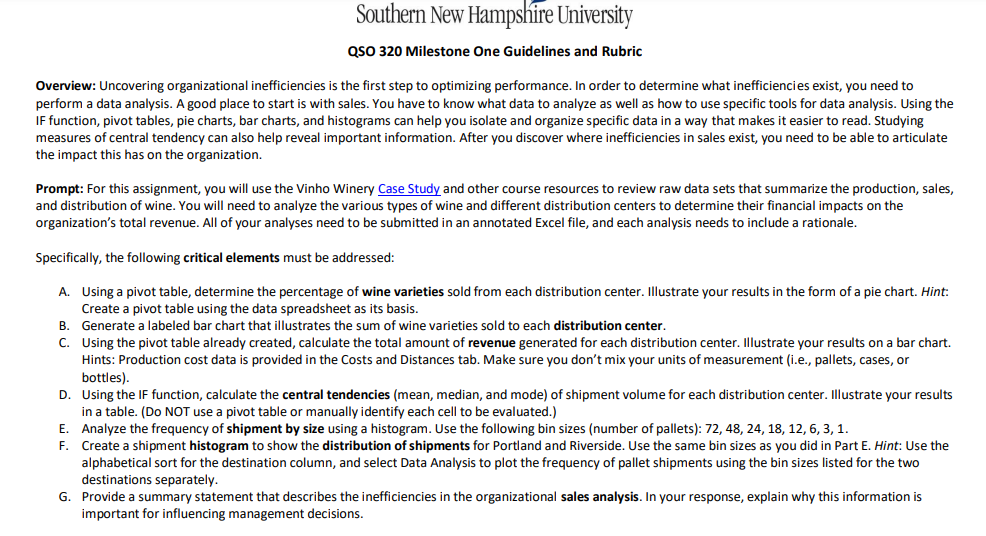
Q50 320 Final Project Business Scenario Milestone One Prompt: The Vinho Winery in Lodi, California produces about one million cases of wine a year. It sells its wine wholesale to four independent wine distributors: Riverside, CA; Oakland, CA; Portland, OR; and Seattle, WA. They produce three varieties of wine: Ruby Red, Murky White, and Whole-Earth Organic. The grapes used to produce the three varieties differ, and their production volumes (augmented by grapes bought from other growers) must be planned at least a year in advance of being pressed into wine. The wine must be aged a year before being sold. Vinho Winery advertises their wines in the areas surrounding their four independent wine distributors, and the cost of this marketing is included in the wine production costs. Vinho contracts with a private trucking company to move full truckloads of wine. A full truck will consist of 24 pallets of wine, totaling 2,688 cases (16,128 bottles). The minimum shipment they will sell is a pallet of wine (112 cases), and they contract out delivery of the pallets unless the cost will exceed the cost of using one of their private trucking company's trucks. Vinho has brokers arrange cargo to be carried on the return trip (backhaul) to avoid having their trucks return empty and needing to pay for the round trip. Since little Lodi is not a major transportation destination, only part of the return trip can be used. (For example, the return from Seattle can be used to move cargo from Seattle to Eureka, but not all the way to Lodi). Vinho Winery was recently bought by a private equity firm, and they want an assessment of current operations. Once completed, they want plans to optimize operations. You are the management consultant who will conduct the assessment and develop the plans. You will be required to create and program spreadsheets for your analysis and conclude with summary statements.Southern New Hampshire University QSO 320 Milestone One Guidelines and Rubric Overview: Uncovering organizational inefficiencies is the first step to optimizing performance. In order to determine what inefficiencies exist, you need to perform a data analysis. A good place to start is with sales. You have to know what data to analyze as well as how to use specific tools for data analysis. Using the IF function, pivot tables, pie charts, bar charts, and histograms can help you isolate and organize specific data in a way that makes it easier to read. Studying measures of central tendency can also help reveal important information. After you discover where inefficiencies in sales exist, you need to be able to articulate the impact this has on the organization. Prompt: For this assignment, you will use the Vinho Winery Case Study and other course resources to review raw data sets that summarize the production, sales, and distribution of wine. You will need to analyze the various types of wine and different distribution centers to determine their financial impacts on the organization's total revenue. All of your analyses need to be submitted in an annotated Excel file, and each analysis needs to include a rationale. Specifically, the following critical elements must be addressed: A. Using a pivot table, determine the percentage of wine varieties sold from each distribution center. Illustrate your results in the form of a pie chart. Hint: Create a pivot table using the data spreadsheet as its basis. B. Generate a labeled bar chart that illustrates the sum of wine varieties sold to each distribution center. C. Using the pivot table already created, calculate the total amount of revenue generated for each distribution center. Illustrate your results on a bar chart. Hints: Production cost data is provided in the Costs and Distances tab. Make sure you don't mix your units of measurement (i.e., pallets, cases, or bottles). D. Using the IF function, calculate the central tendencies (mean, median, and mode) of shipment volume for each distribution center. Illustrate your results in a table. (Do NOT use a pivot table or manually identify each cell to be evaluated.) E. Analyze the frequency of shipment by size using a histogram. Use the following bin sizes (number of pallets): 72, 48, 24, 18, 12, 6, 3, 1. F. Create a shipment histogram to show the distribution of shipments for Portland and Riverside. Use the same bin sizes as you did in Part E. Hint: Use the alphabetical sort for the destination column, and select Data Analysis to plot the frequency of pallet shipments using the bin sizes listed for the two destinations separately. G. Provide a summary statement that describes the inefficiencies in the organizational sales analysis. In your response, explain why this information is important for influencing management decisions
Step by Step Solution
There are 3 Steps involved in it
Step: 1
To complete the analysis for Vinho Winery you need to perform several Excelbased tasks Heres how you can proceed with each element A Pivot Table and P...
Get Instant Access to Expert-Tailored Solutions
See step-by-step solutions with expert insights and AI powered tools for academic success
Step: 2
Step: 3
Ace Your Homework with AI
Get the answers you need in no time with our AI-driven, step-by-step assistance