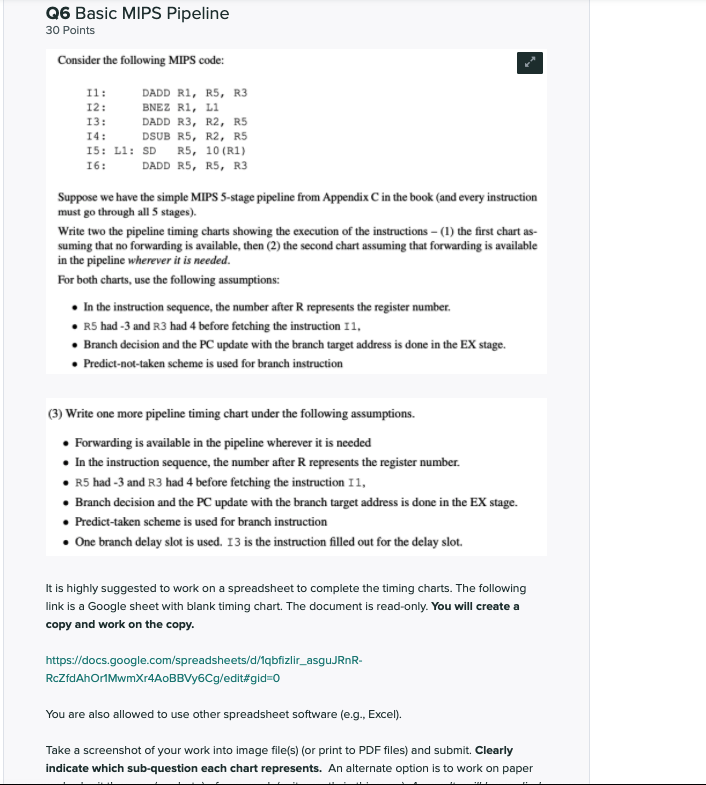
Q6 Basic MIPS Pipeline 30 Points Consider the following MIPS code: 11: DADD R1, R5, R3 12: BNEZ R1, L1 13: DADD R3, R2, R5 14: DSUB R5, R2, R5 15: Ll: SDR5, 10 (R1) 16: DADD R5, RS, R3 Suppose we have the simple MIPS 5-stage pipeline from Appendix C in the book (and every instruction must go through all 5 stages). Write two the pipeline timing charts showing the execution of the instructions - (1) the first chart as- suming that no forwarding is available, then (2) the second chart assuming that forwarding is available in the pipeline wherever it is needed. For both charts, use the following assumptions: In the instruction sequence, the number after R represents the register number. R5 had - 3 and R3 had 4 before fetching the instruction 11. Branch decision and the PC update with the branch target address is done in the EX stage. Predict-not-taken scheme is used for branch instruction (3) Write one more pipeline timing chart under the following assumptions. Forwarding is available in the pipeline wherever it is needed . In the instruction sequence, the number after R represents the register number. R5 had-3 and R3 had 4 before fetching the instruction 11, Branch decision and the PC update with the branch target address is done in the EX stage. Predict-taken scheme is used for branch instruction One branch delay slot is used. 13 is the instruction filled out for the delay slot. It is highly suggested to work on a spreadsheet to complete the timing charts. The following link is a Google sheet with blank timing chart. The document is read-only. You will create a copy and work on the copy. https://docs.google.com/spreadsheets/d/1qbfizlir_asguJRnR- RcZfdAhorMwmXr4AOBBVy6Cg/edit#gid=0 You are also allowed to use other spreadsheet software (e.g., Excel). Take a screenshot of your work into image file(s) (or print to PDF files) and submit. Clearly indicate which sub-question each chart represents. An alternate option is to work on paper Q6 Basic MIPS Pipeline 30 Points Consider the following MIPS code: 11: DADD R1, R5, R3 12: BNEZ R1, L1 13: DADD R3, R2, R5 14: DSUB R5, R2, R5 15: Ll: SDR5, 10 (R1) 16: DADD R5, RS, R3 Suppose we have the simple MIPS 5-stage pipeline from Appendix C in the book (and every instruction must go through all 5 stages). Write two the pipeline timing charts showing the execution of the instructions - (1) the first chart as- suming that no forwarding is available, then (2) the second chart assuming that forwarding is available in the pipeline wherever it is needed. For both charts, use the following assumptions: In the instruction sequence, the number after R represents the register number. R5 had - 3 and R3 had 4 before fetching the instruction 11. Branch decision and the PC update with the branch target address is done in the EX stage. Predict-not-taken scheme is used for branch instruction (3) Write one more pipeline timing chart under the following assumptions. Forwarding is available in the pipeline wherever it is needed . In the instruction sequence, the number after R represents the register number. R5 had-3 and R3 had 4 before fetching the instruction 11, Branch decision and the PC update with the branch target address is done in the EX stage. Predict-taken scheme is used for branch instruction One branch delay slot is used. 13 is the instruction filled out for the delay slot. It is highly suggested to work on a spreadsheet to complete the timing charts. The following link is a Google sheet with blank timing chart. The document is read-only. You will create a copy and work on the copy. https://docs.google.com/spreadsheets/d/1qbfizlir_asguJRnR- RcZfdAhorMwmXr4AOBBVy6Cg/edit#gid=0 You are also allowed to use other spreadsheet software (e.g., Excel). Take a screenshot of your work into image file(s) (or print to PDF files) and submit. Clearly indicate which sub-question each chart represents. An alternate option is to work on paper