Answered step by step
Verified Expert Solution
Question
1 Approved Answer
Q6 In the lecture, we have studied the historical simulation approach to market risk VaR using a sample of 500 observations and applied it to
Q6
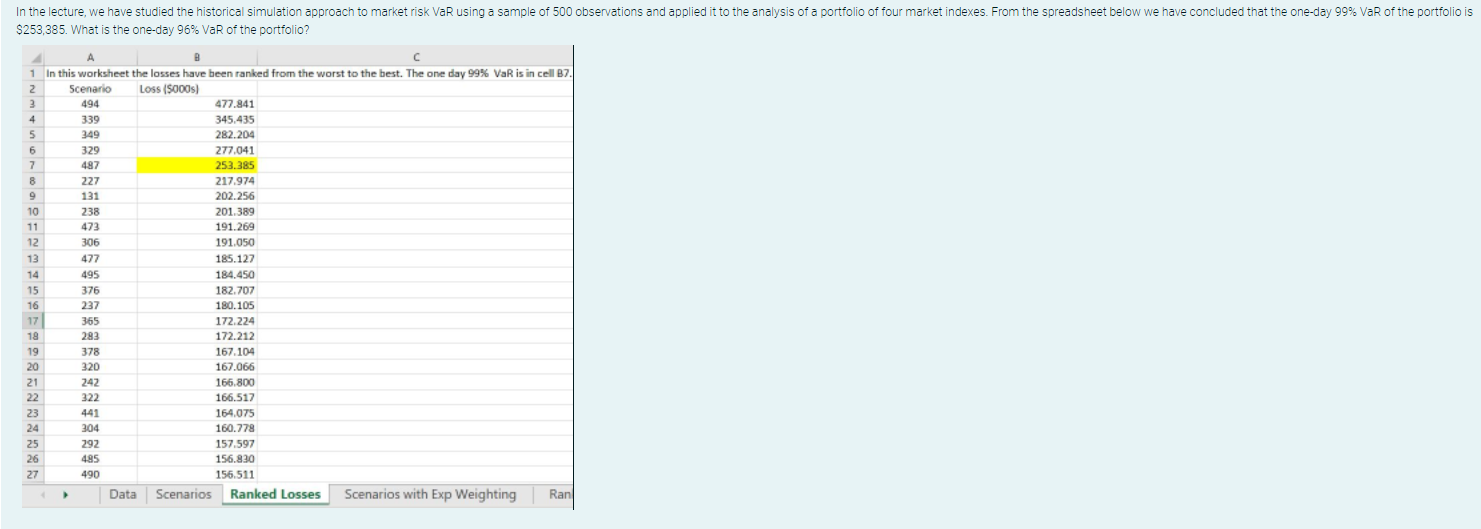
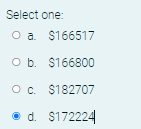
In the lecture, we have studied the historical simulation approach to market risk VaR using a sample of 500 observations and applied it to the analysis of a portfolio of four market indexes. From the spreadsheet below we have concluded that the one-day 99% VaR of the portfolio is $253,385. What is the one-day 96% VaR of the portfolio? B 1 In this worksheet the losses have been ranked from the worst to the best. The one day 99% VaR is in cell B7. 2 Scenario Loss (5000s) 3 494 477.841 4 339 345.435 5 349 282.204 6 329 277.041 7 487 253.385 8 227 217.974 9 131 202.256 10 238 201.389 11 473 104 191.269 12 2016 10 306 191.050 - 13 477 185.127 14 495 184,450 15 376 182.707 16 227 237 1000 180.105 17 365 172.224 18 18 292 283 172.212 19 378 378 167.104 20 320 167.066 21 242 166.800 22 322 166.517 23 441 164.075 24 304 160.778 25 292 157.597 26 495 156.830 27 490 156.511 Data Scenarios Ranked Losses Scenarios with Exp Weighting Ran Select one: : O a $166517 Ob. $166800 OC. $182707 d. $172224 In the lecture, we have studied the historical simulation approach to market risk VaR using a sample of 500 observations and applied it to the analysis of a portfolio of four market indexes. From the spreadsheet below we have concluded that the one-day 99% VaR of the portfolio is $253,385. What is the one-day 96% VaR of the portfolio? B 1 In this worksheet the losses have been ranked from the worst to the best. The one day 99% VaR is in cell B7. 2 Scenario Loss (5000s) 3 494 477.841 4 339 345.435 5 349 282.204 6 329 277.041 7 487 253.385 8 227 217.974 9 131 202.256 10 238 201.389 11 473 104 191.269 12 2016 10 306 191.050 - 13 477 185.127 14 495 184,450 15 376 182.707 16 227 237 1000 180.105 17 365 172.224 18 18 292 283 172.212 19 378 378 167.104 20 320 167.066 21 242 166.800 22 322 166.517 23 441 164.075 24 304 160.778 25 292 157.597 26 495 156.830 27 490 156.511 Data Scenarios Ranked Losses Scenarios with Exp Weighting Ran Select one: : O a $166517 Ob. $166800 OC. $182707 d. $172224Step by Step Solution
There are 3 Steps involved in it
Step: 1
Get Instant Access to Expert-Tailored Solutions
See step-by-step solutions with expert insights and AI powered tools for academic success
Step: 2
Step: 3
Ace Your Homework with AI
Get the answers you need in no time with our AI-driven, step-by-step assistance
Get Started