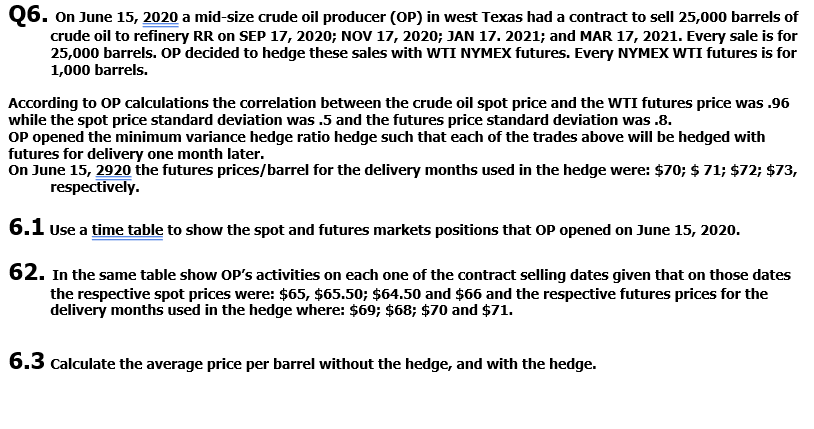
Q6. On June 15, 2020 a mid-size crude oil producer (OP) in west Texas had a contract to sell 25,000 barrels of crude oil to refinery RR on SEP 17, 2020; NOV 17, 2020; JAN 17, 2021; and MAR 17, 2021. Every sale is for 25,000 barrels. Op decided to hedge these sales with WTI NYMEX futures. Every NYMEX WTI futures is for 1,000 barrels. According to OP calculations the correlation between the crude oil spot price and the WTI futures price was.96 while the spot price standard deviation was 5 and the futures price standard deviation was.8. OP opened the minimum variance hedge ratio hedge such that each of the trades above will be hedged with futures for delivery one month later. On June 15, 2920 the futures prices/barrel for the delivery months used in the hedge were: $70; $ 71; $72; $73, respectively. 6.1 Use a time table to show the spot and futures markets positions that OP opened on June 15, 2020. 62. In the same table show OP's activities on each one of the contract selling dates given that on those dates the respective spot prices were: $65, $65.50; $64.50 and $66 and the respective futures prices for the delivery months used in the hedge where: $69; $68; $70 and $71. 6.3 calculate the average price per barrel without the hedge, and with the hedge. Q6. On June 15, 2020 a mid-size crude oil producer (OP) in west Texas had a contract to sell 25,000 barrels of crude oil to refinery RR on SEP 17, 2020; NOV 17, 2020; JAN 17, 2021; and MAR 17, 2021. Every sale is for 25,000 barrels. Op decided to hedge these sales with WTI NYMEX futures. Every NYMEX WTI futures is for 1,000 barrels. According to OP calculations the correlation between the crude oil spot price and the WTI futures price was.96 while the spot price standard deviation was 5 and the futures price standard deviation was.8. OP opened the minimum variance hedge ratio hedge such that each of the trades above will be hedged with futures for delivery one month later. On June 15, 2920 the futures prices/barrel for the delivery months used in the hedge were: $70; $ 71; $72; $73, respectively. 6.1 Use a time table to show the spot and futures markets positions that OP opened on June 15, 2020. 62. In the same table show OP's activities on each one of the contract selling dates given that on those dates the respective spot prices were: $65, $65.50; $64.50 and $66 and the respective futures prices for the delivery months used in the hedge where: $69; $68; $70 and $71. 6.3 calculate the average price per barrel without the hedge, and with the hedge