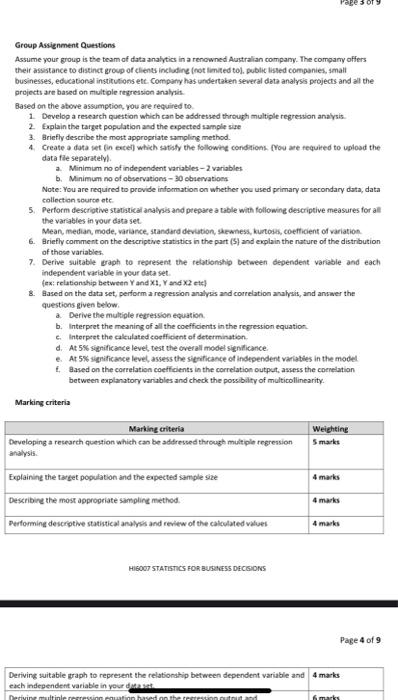
Q.N. (2) You have called your foreign exchange trader and asked for quotations of dollar and euro on the spot, one month, three month, and six months. The trader has responded with the following: $ 0.2475/79 3/5 8/7 13/10 (a) What does this mean in terms of dollars per euro? (b) What is the premium or discount in the one and three-months forward rates? Group Assignment Questions Assume your group is the team of data analytics in a renowned Australian company. The company offers their assistance to distinct group of clients including frottimited to, public listed companies, small businesses, educational institutions etc. Company has undertaken several data analysis projects and all the projects are based on multiple regression analysis Based on the above assumption, you are required to 1 Develop a research question which can be addressed through multiple regression analysis 2 Explain the target population and the expected samplesie 3. Briefly describe the most appropriate sampling method 4 Create a data set in exter which satisfy the following condition. (You are required to upload the data file separately 2. Minimum no of independent variables - 2 variables b. Minimum no of observations - 30 observations Note: You are required to provide information on whether you used primary or secondary data, data collection source etc 5. Perform descriptive statistical analysis and prepare a table with following descriptive measures for at the variables in your data set Mean, median, mode, variance, standard deviation, skewness, kurtos, coefficient of variation 6. Brietly comment on the descriptive statistics in the part (S) and explain the nature of the distribution 7. Derive suitable vraph to represent the relationship between dependent variable and each independent variable in your data set (ex: relationship between Y and X1 Y and X2 etc) & Based on the data set, perform a regression analysis and correlation analysis, and answer the questions given below Derive the multiple regression equation. b. Interpret the meaning of all the coefficients in the regression equation c. Interpret the cakeulated coefficient of determination d. At 5% significance levet test the overall model significance e. At 5% significance level, assess the significance of independent variables in the model Based on the correlation coefficients in the correlation output, assess the correlation between explanatory variables and check the possibility of multicolinearity. Marking criteria Marking criteria Developing a research question which can be addressed through multiple regression analysis Weighting Smarks Explaining the target population and the expected sample size Describing the most appropriate sampling method Performing descriptive statistical analysis and review of the calculated values 4 marks HI6007 STATISTICS FOR BUSINESS DECISIONS Page 4 of 9 Deriving suitable graph to represent the relationship between dependent variable and 4 marks each independent variable in your de Denvinetinlercresciuto in the mark Q.N. (2) You have called your foreign exchange trader and asked for quotations of dollar and euro on the spot, one month, three month, and six months. The trader has responded with the following: $ 0.2475/79 3/5 8/7 13/10 (a) What does this mean in terms of dollars per euro? (b) What is the premium or discount in the one and three-months forward rates? Group Assignment Questions Assume your group is the team of data analytics in a renowned Australian company. The company offers their assistance to distinct group of clients including frottimited to, public listed companies, small businesses, educational institutions etc. Company has undertaken several data analysis projects and all the projects are based on multiple regression analysis Based on the above assumption, you are required to 1 Develop a research question which can be addressed through multiple regression analysis 2 Explain the target population and the expected samplesie 3. Briefly describe the most appropriate sampling method 4 Create a data set in exter which satisfy the following condition. (You are required to upload the data file separately 2. Minimum no of independent variables - 2 variables b. Minimum no of observations - 30 observations Note: You are required to provide information on whether you used primary or secondary data, data collection source etc 5. Perform descriptive statistical analysis and prepare a table with following descriptive measures for at the variables in your data set Mean, median, mode, variance, standard deviation, skewness, kurtos, coefficient of variation 6. Brietly comment on the descriptive statistics in the part (S) and explain the nature of the distribution 7. Derive suitable vraph to represent the relationship between dependent variable and each independent variable in your data set (ex: relationship between Y and X1 Y and X2 etc) & Based on the data set, perform a regression analysis and correlation analysis, and answer the questions given below Derive the multiple regression equation. b. Interpret the meaning of all the coefficients in the regression equation c. Interpret the cakeulated coefficient of determination d. At 5% significance levet test the overall model significance e. At 5% significance level, assess the significance of independent variables in the model Based on the correlation coefficients in the correlation output, assess the correlation between explanatory variables and check the possibility of multicolinearity. Marking criteria Marking criteria Developing a research question which can be addressed through multiple regression analysis Weighting Smarks Explaining the target population and the expected sample size Describing the most appropriate sampling method Performing descriptive statistical analysis and review of the calculated values 4 marks HI6007 STATISTICS FOR BUSINESS DECISIONS Page 4 of 9 Deriving suitable graph to represent the relationship between dependent variable and 4 marks each independent variable in your de Denvinetinlercresciuto in the mark


