

Question: Quantity 9. In the above figure, an increase in the quantity demanded is represented by a movement from point d to: point b only
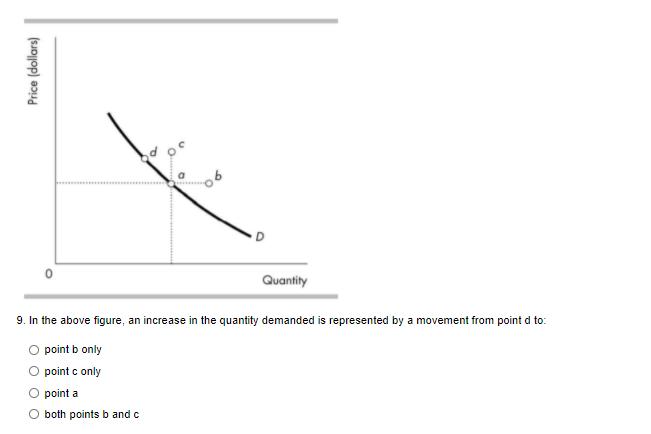
Quantity 9. In the above figure, an increase in the quantity demanded is represented by a movement from point d to: point b only O point c only O point a both points b and c Price (dollars)
Step by Step Solution
★★★★★
3.40 Rating (153 Votes )
There are 3 Steps involved in it
1 Expert Approved Answer
Step: 1 Unlock

Question Has Been Solved by an Expert!
Get step-by-step solutions from verified subject matter experts
Step: 2 Unlock
Step: 3 Unlock