Answered step by step
Verified Expert Solution
Question
1 Approved Answer
Question 1 1 pts The displayed figure is a histogram of the percent of on-time high school graduates in each state. 20 15- Number of
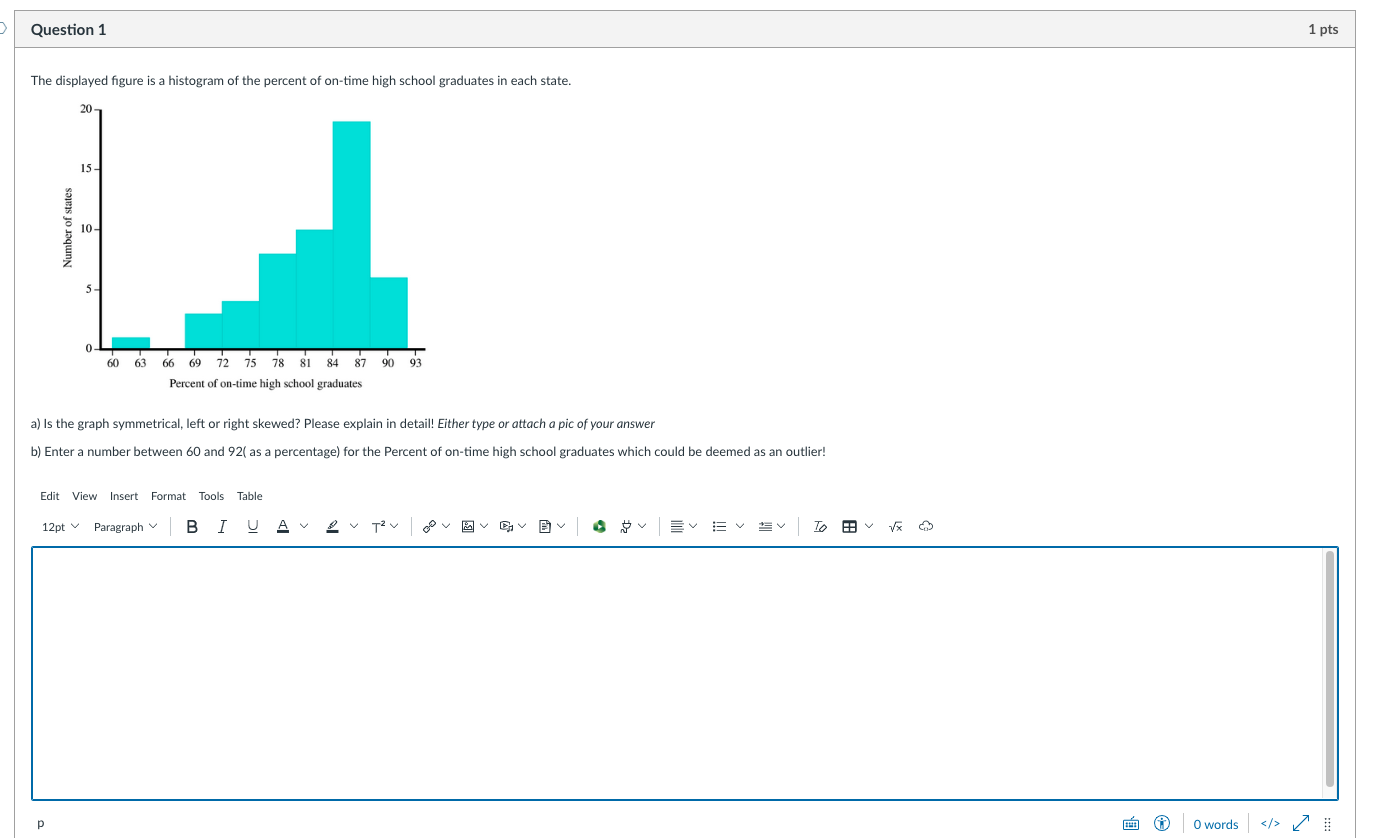
Question 1 1 pts The displayed figure is a histogram of the percent of on-time high school graduates in each state. 20 15- Number of states 10- 60 63 66 69 72 75 78 81 84 87 909 Percent of on-time high school graduates a) Is the graph symmetrical, left or right skewed? Please explain in detail! Either type or attach a pic of your answer b) Enter a number between 60 and 92( as a percentage) for the Percent of on-time high school graduates which could be deemed as an outlier! Edit View Insert Format Tools Table 12pt \\ Paragraph * B I U A v Z V T V Q V E V Q V BY Q V V EVEV D BV VQ : 1 0 words > >Question 2 0.5 pts The exam scores of 10 students in a statistics class are listed below: 50 25 41 95 76 69 90 23 35 35 Here 50 is represented as 5|0 in a stem plot The HIGHEST leaf of the student scores is? In other words, the number that is highest on the UNITS column( the leaf) - For example: if the data is 24, 29, 22, the highest leaf is 9 Question 3 1 pts The table contains the first lines of a professor's data set at the end of a statistics course. Name Major Total points Grade ADVANI, SURA COMM 397 BARTON, DAVID HIST 323 BROWN, ANNETTE BIOL 446 CHIU, SUN PSYC 405 B CORTEZ, MARIA PSYC 461 A The quantitative variable in these data is O a. the students. O b. the total points O c. the Major O d. Grades
Step by Step Solution
There are 3 Steps involved in it
Step: 1
Get Instant Access to Expert-Tailored Solutions
See step-by-step solutions with expert insights and AI powered tools for academic success
Step: 2
Step: 3
Ace Your Homework with AI
Get the answers you need in no time with our AI-driven, step-by-step assistance
Get Started