Answered step by step
Verified Expert Solution
Question
1 Approved Answer
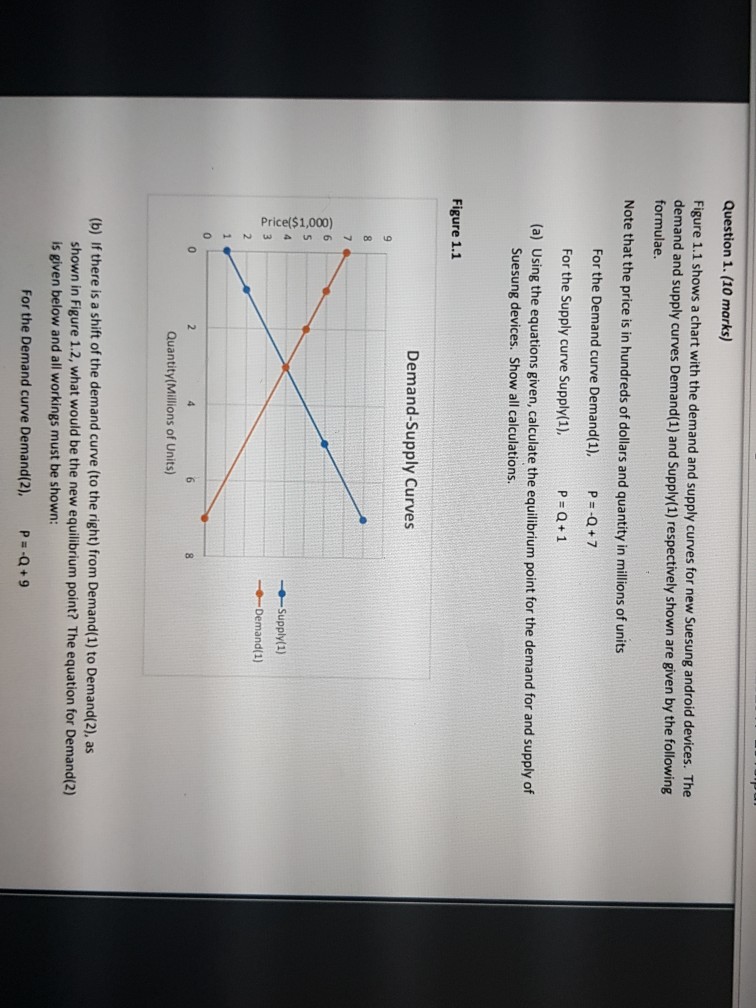
Question 1. (10 marks) Figure 1.1 shows a chart with the demand and supply curves for new Suesung android devices. The demand and supply curves


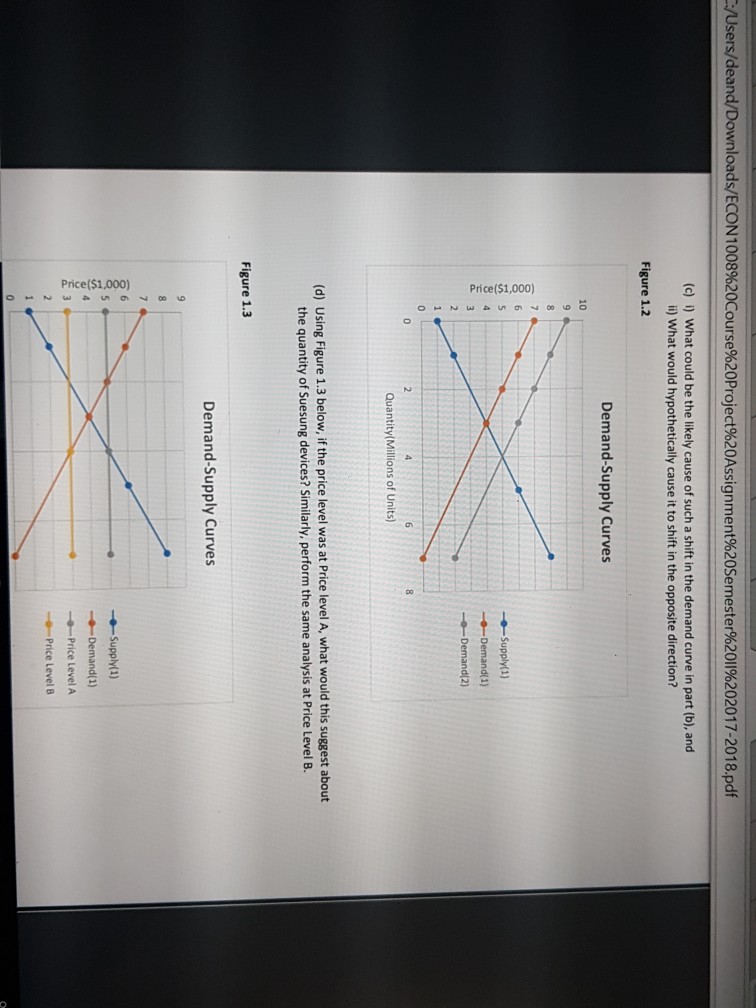
Question 1. (10 marks) Figure 1.1 shows a chart with the demand and supply curves for new Suesung android devices. The demand and supply curves Demand(1) and Supply(1) respectively shown are given by the following formulae. Note that the price is in hundreds of dollars and quantity in millions of units For the Demand curve Demand(1), P Q+7 For the Supply curve Supply(1), (a) Using the equations given, calculate the equilibrium point for the demand for and supply of Suesung devices. Show all calculations. Figure 1.1 Demand-Supply Curves Supply(1) Demand(1) Quantity(Millions of Units) (b) If there is a shift of the demand curve (to the right) from Demand(1) to Demand/2), as shown in Figure 1.2, what would be the new equilibrium point? The equation for Demand(2) is given below and all workings must be shown: For the Demand curve Demand(2), P-Q+9
Step by Step Solution
There are 3 Steps involved in it
Step: 1

Get Instant Access to Expert-Tailored Solutions
See step-by-step solutions with expert insights and AI powered tools for academic success
Step: 2

Step: 3

Ace Your Homework with AI
Get the answers you need in no time with our AI-driven, step-by-step assistance
Get Started


