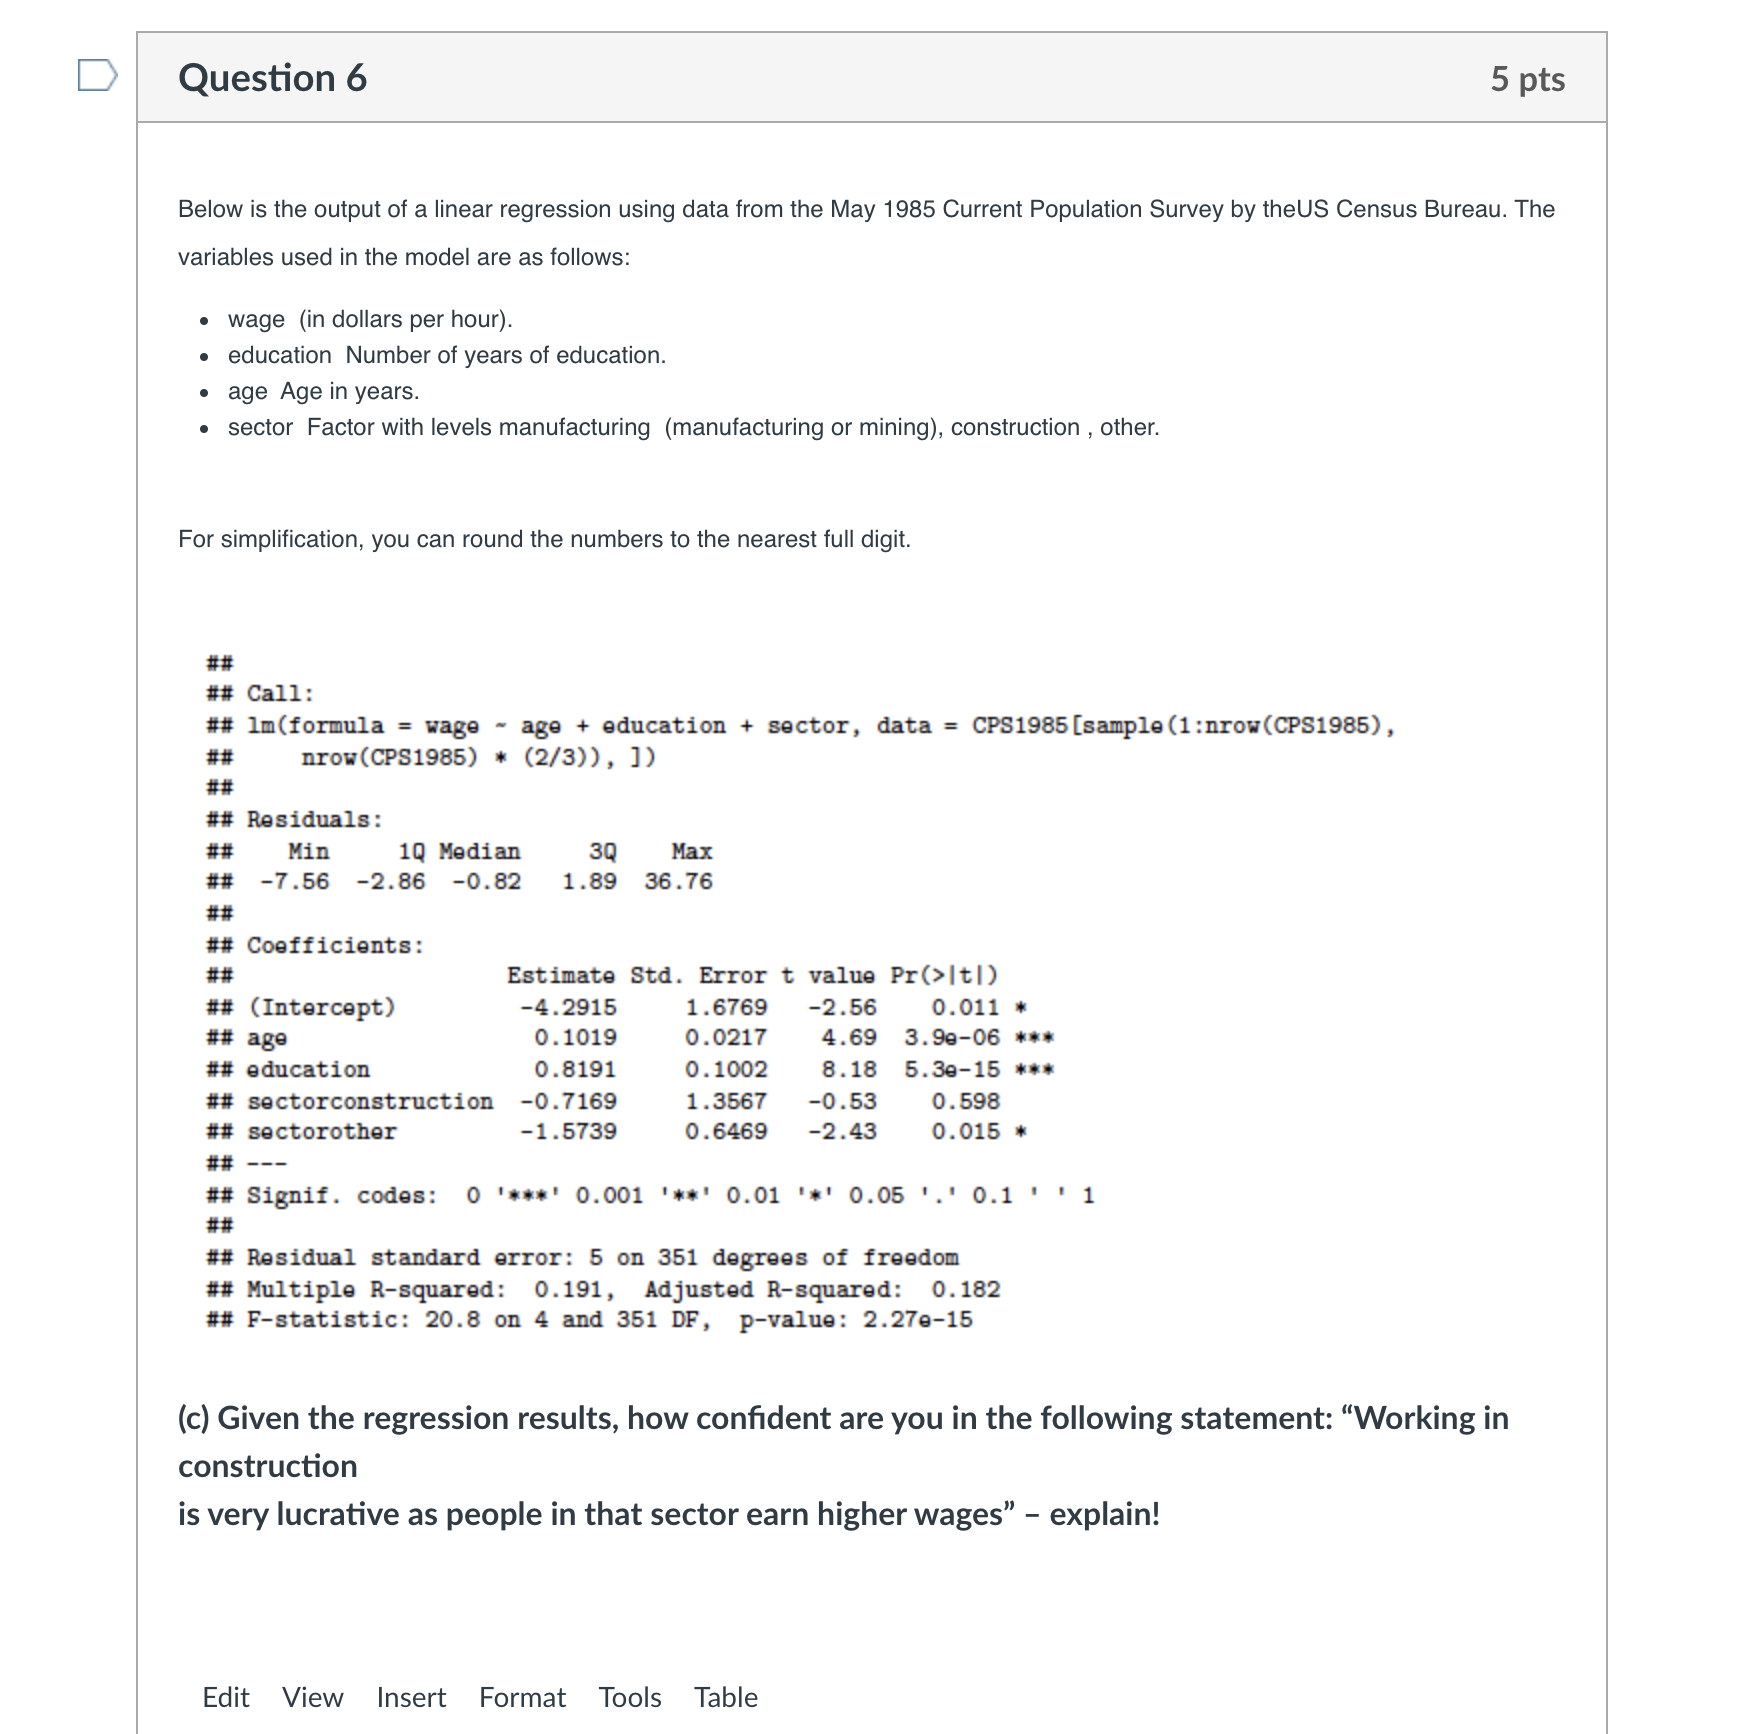
Question 1 10 pts A critical rst step in data mining is to perform initial exploratory data analysis. You have collected a data set of statistics of supporters of various sports teams. You have salary information for fans of the Red Sox and Mets: 10,000 fans each. What graphical technique could you use to compare the distributions of salaries for fans of the two teams? Explain what this might look like. Make sure your method allows for easy comparison of the mean or median of the distribution. Edit View Insert Format Tools Table 12pt V Paragraph V B I U A V g V T2 V p 6') Owords > l/l D Question 2 5 pts This question refers to the same regression equation as the previous question. What is the most common criterion used to determine the best-tting line? 0 The line that goes through the most points. 0 The line that has the same number of points above it as below it. Q The line that minimizes the sum of squared errors of prediction. D Question 3 5 pts This question refers to the same regression equation as the previous question. Suppose a person got a score of 32.5 on Test A and a score of 95.25 on Test B. Using the same regression equation as in the previous problem, what is the error of prediction for this person? Edit View Insert Format Tools Table 12pt Paragraph B I U A & TV ... p O words >Question 4 10 pts This question relates to the diagram shown below. Sketch a decision tree corresponding to the partition of the predictor space illustrated in the gure. The classes inside the boxes indicate the response. Use only binary splits and classify every record correctly. You can eigher graphically represent your decision tree or write it down as decision rules ("if X greater/ less than Y then 2\"). Edit View Insert Format Tools Table 12pt V Paragraph V B I U v i v T2 v p 6') IOwordsl > If Question 5 5 pts Suppose it is possible to predict a person's score on standardized Test B from the person's score on another standardized Test A. The regression equation is: B = 2.8A + 9.8. What is a person's predicted score on Test B assuming this person got a 45 on Test A? Edit View Insert Format Tools Table '_|2ptV Paragraphv l B I U AV V T2\\/ 6') |0words| > ./ D Question 6 5 pts Below is the output of a linear regression using data from the May 1985 Current Population Survey by theUS Census Bureau. The variables used in the model are as follows: . wage (in dollars per hour). . education Number of years of education. age Age in years . sector Factor with levels manufacturing (manufacturing or mining), construction , other. For simplification, you can round the numbers to the nearest full digit. # # ## Call: ## 1m(formula = wage - age + education + sector, data = CPS1985 [sample (1 :nrow(CPS1985) , ## nrow (CPS1985) * (2/3)) , ]) ## Residuals: # # Min 10 Median 3Q Max # # -7.56 -2.86 -0.82 1.89 36.76 ## Coefficients: # # Estimate Std. Error t value Pr(>|t/) ## (Intercept) -4.2915 1.6769 -2.56 0. 011 # ## age 0. 1019 0. 0217 4.69 3.98-06 ** * ## education 0. 8191 0. 1002 8.18 5.30-15 *** ## sectorconstruction -0.7169 1.3567 -0.53 0. 598 ## sectorother -1.5739 0. 6469 -2.43 0. 015 * # # ## Signif. codes: 0 '**#' 0.001 '*#' 0.01 '*' 0.05 . .' 0.1 . . 1 # # ## Residual standard error: 5 on 351 degrees of freedom ## Multiple R-squared: 0.191, Adjusted R-squared: 0.182 ## F-statistic: 20.8 on 4 and 351 DF, p-value: 2.27e-15 (c) Given the regression results, how confident are you in the following statement: "Working in construction is very lucrative as people in that sector earn higher wages" - explain! Edit View Insert Format Tools TableD Question 7 5 pts Below is the output of a linear regression using data from the May 1985 Current Population Survey by theUS Census Bureau. The variables used in the model are as follows: . wage (in dollars per hour). . education Number of years of education. . age Age in years sector Factor with levels manufacturing (manufacturing or mining), construction , other. For simplification, you can round the numbers to the nearest full digit. # # ## Call: ## 1m(formula = wage ~ age + education + sector, data = CPS1985 [sample (1:nrow(CPS1985) , # # nrow (CPS1985) * (2/3)) , ]) ## Residuals: # # Min 1Q Median 3Q Max # # -7.56 -2.86 -0.82 1.89 36.76 # # ## Coefficients: # # Estimate Std. Error t value Pr(>Itl) ## (Intercept) -4.2915 1.6769 -2.56 0. 011 * ## age 0. 1019 0. 0217 4.69 3.98-06 ** * ## education 0. 8191 0. 1002 8.18 5.3e-15 ** * ## sectorconstruction -0.7169 1.3567 -0.53 0. 598 ## sectorother -1.5739 0.6469 -2.43 0. 015 * ## --- ## Signif. codes: 0 '**#' 0.001 '*#' 0.01 '*' 0.05 ' . ' 0.1 . . 1 # # ## Residual standard error: 5 on 351 degrees of freedom ## Multiple R-squared: 0.191, Adjusted R-squared: 0.182 ## F-statistic: 20.8 on 4 and 351 DF, p-value: 2.270-15 (b) What hourly wage would you predict for a 45 year old male with 12 years of education who is working in manufacturing? (You can round numbers to two digits after the decimal to simplify your calculations.) Edit View Insert Format Tools Table 12pt V Paragraph BI UAV QV T VD Question 8 5 pts Below is the output of a linear regression using data from the May 1985 Current Population Survey by theUS Census Bureau. The variables used in the model are as follows: . wage (in dollars per hour). . education Number of years of education. . age Age in years. sector Factor with levels manufacturing (manufacturing or mining), construction , other. For simplification, you can round the numbers to the nearest full digit. # # ## Call: ## 1m(formula = wage - age + education + sector, data = CPS1985 [sample (1:nrow(CPS1985) , ## nrow (CPS1985) * (2/3)) , ]) # # ## Residuals: # # Min 1Q Median 3Q Max # # -7.56 -2.86 -0.82 1 .89 36.76 # # ## Coefficients: # # Estimate Std. Error t value Pr(>Itl) ## (Intercept) -4.2915 1.6769 -2.56 0. 011 * ## ag 0. 1019 0. 0217 4.69 3.90-06 * * * ## education 0. 8191 0. 1002 8.18 5.30-15 *#* ## sectorconstruction -0.7169 1.3567 -0.53 0. 598 ## sectorother -1.5739 0. 6469 -2.43 0. 015 * # # --- ## Signif. codes: 0 '***' 0.001 '*#' 0.01 '*' 0.05 . . ' 0.1 . . 1 ## ## Residual standard error: 5 on 351 degrees of freedom ## Multiple R-squared: 0.191, Adjusted R-squared: 0.182 ## F-statistic: 20.8 on 4 and 351 DF, p-value: 2.27e-15 (a) How can you explain the negative intercept? What does this tell you about the data? Edit View Insert Format Tools Table 12pt v Paragraph B I U A & TV :D Question 9 5 pts The formula for a regression equation is Y = 4X -1 . What would be the predicted Y score for a person scoring 4 on X ? Edit View Insert Format Tools Table 12pt v Paragraph B I U AV Q V T V : p # O words >