Question 1, 16.3.11 O HW Score: 0%, 0 of 3 points Part 1 of 5 O Points: 0 of 1 Save The linear trend forecasting
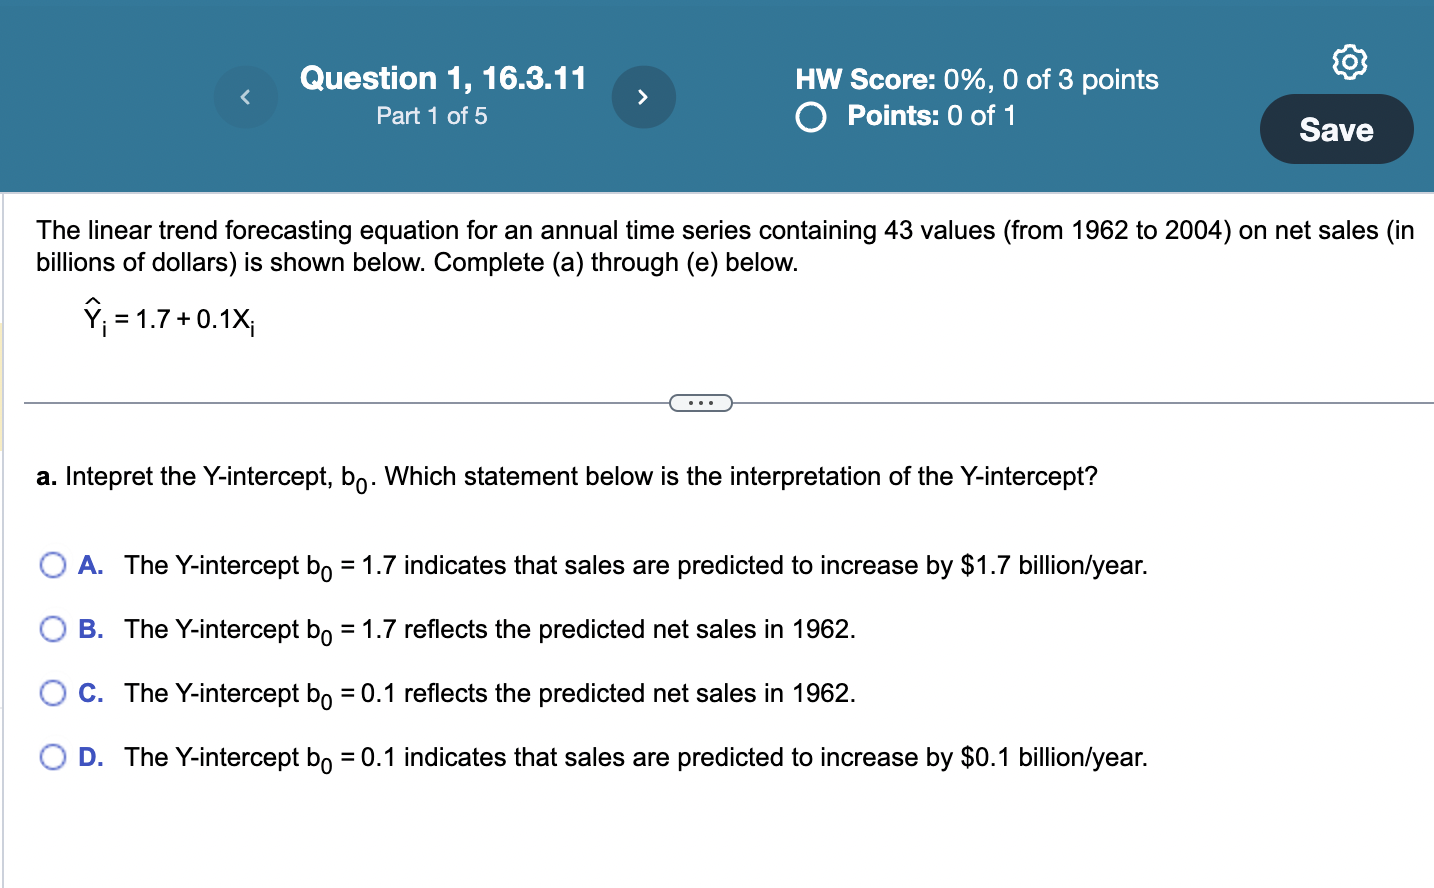
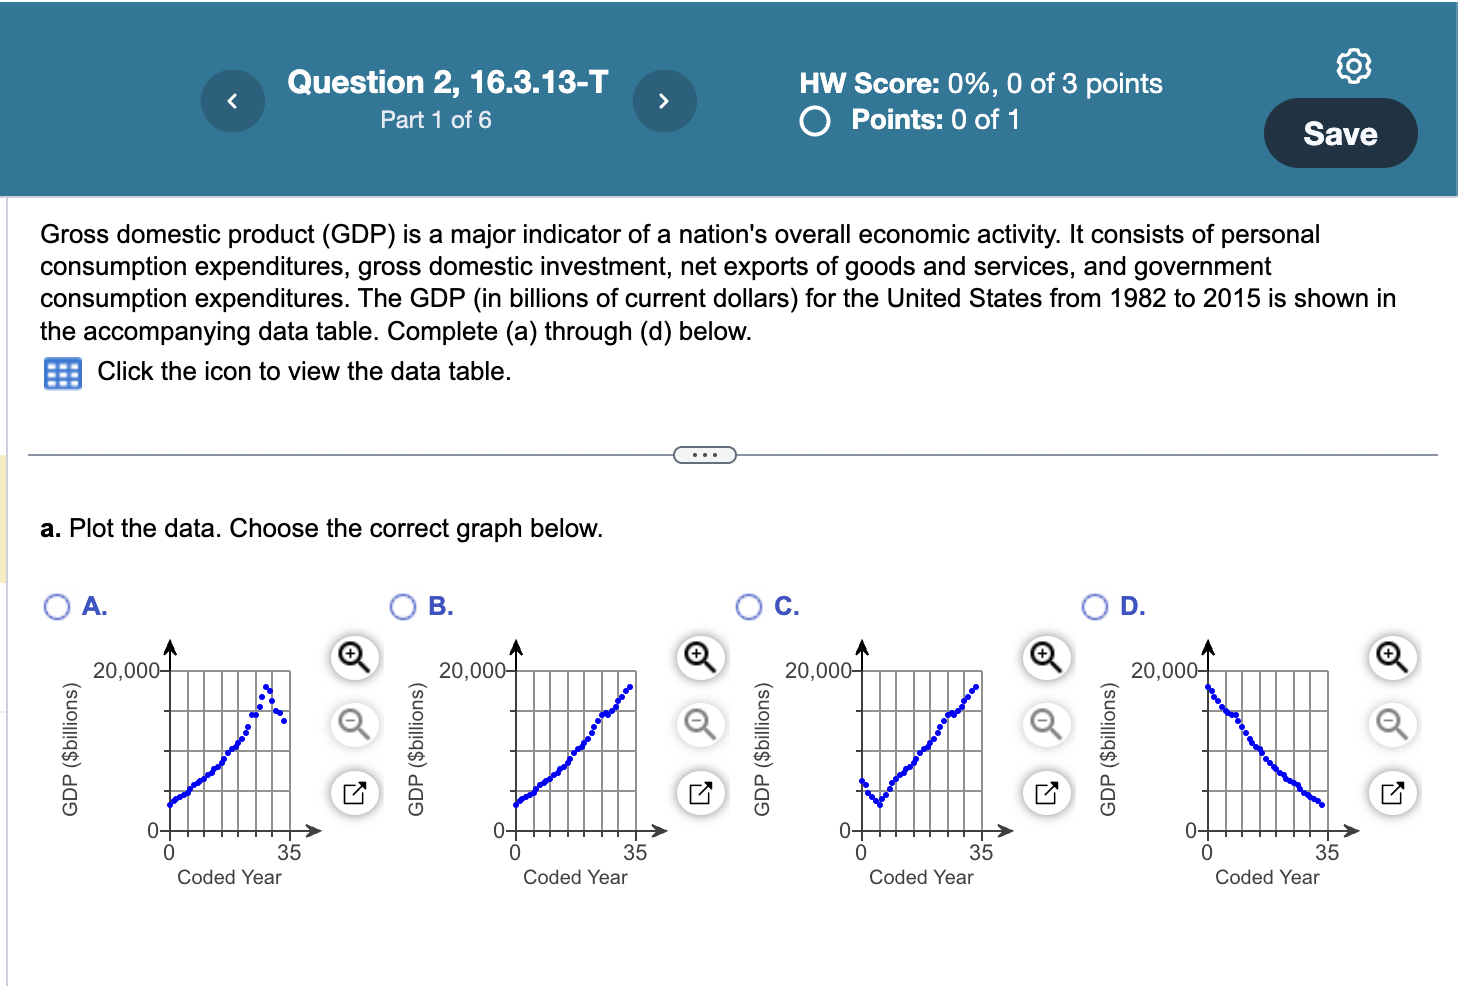
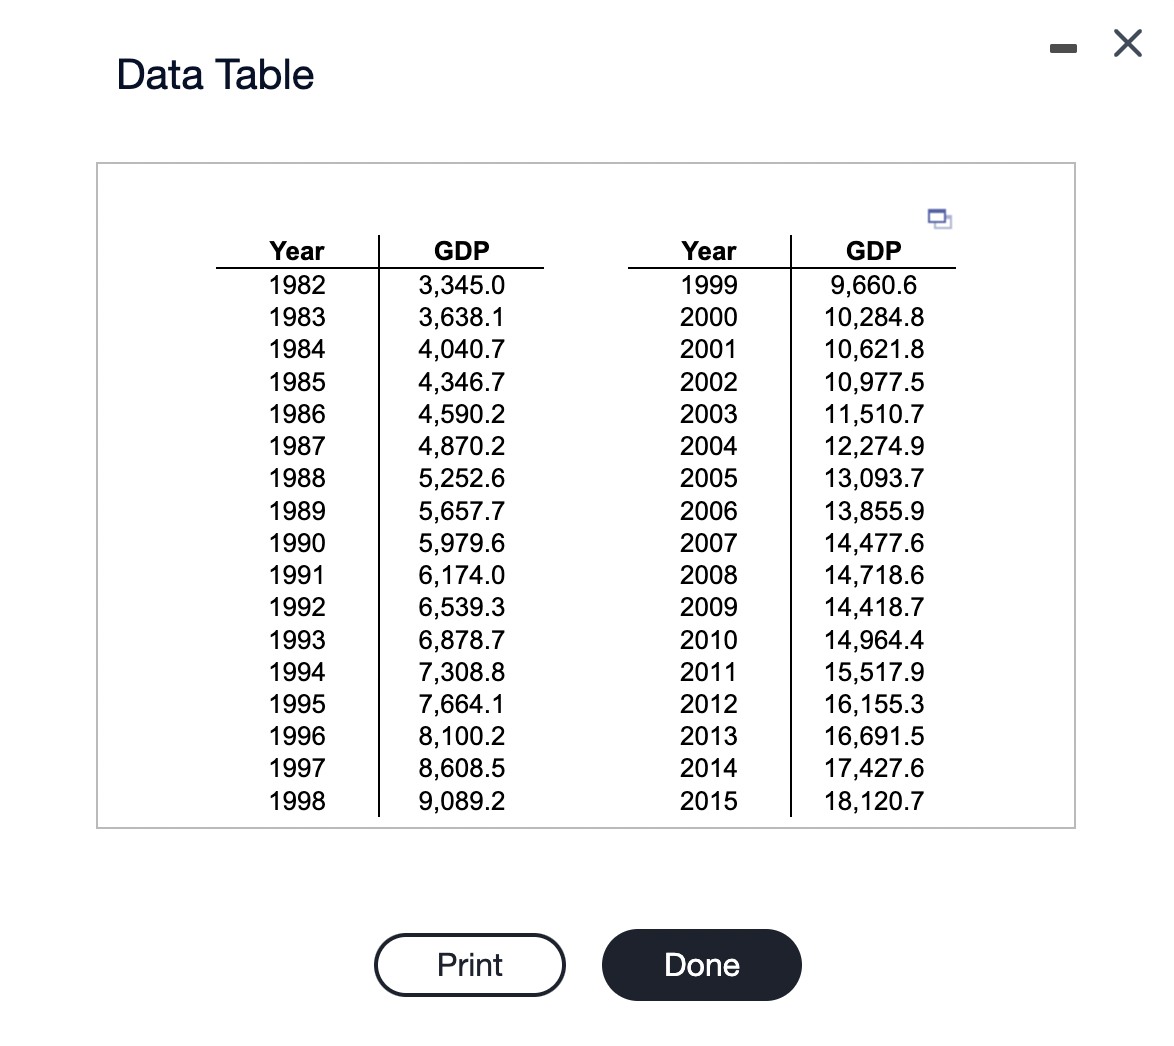
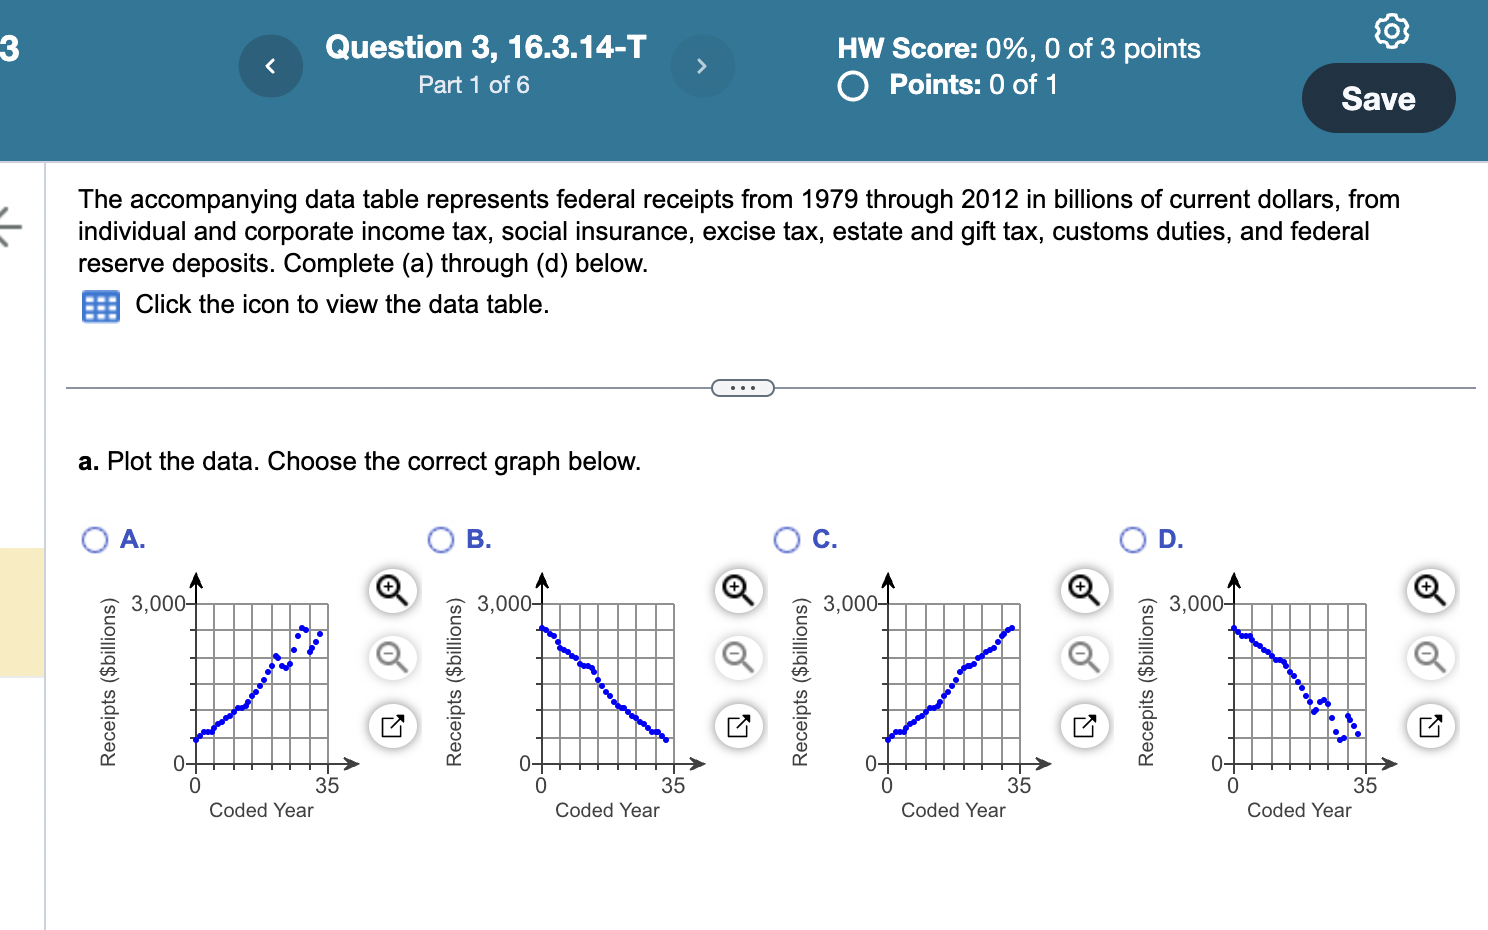
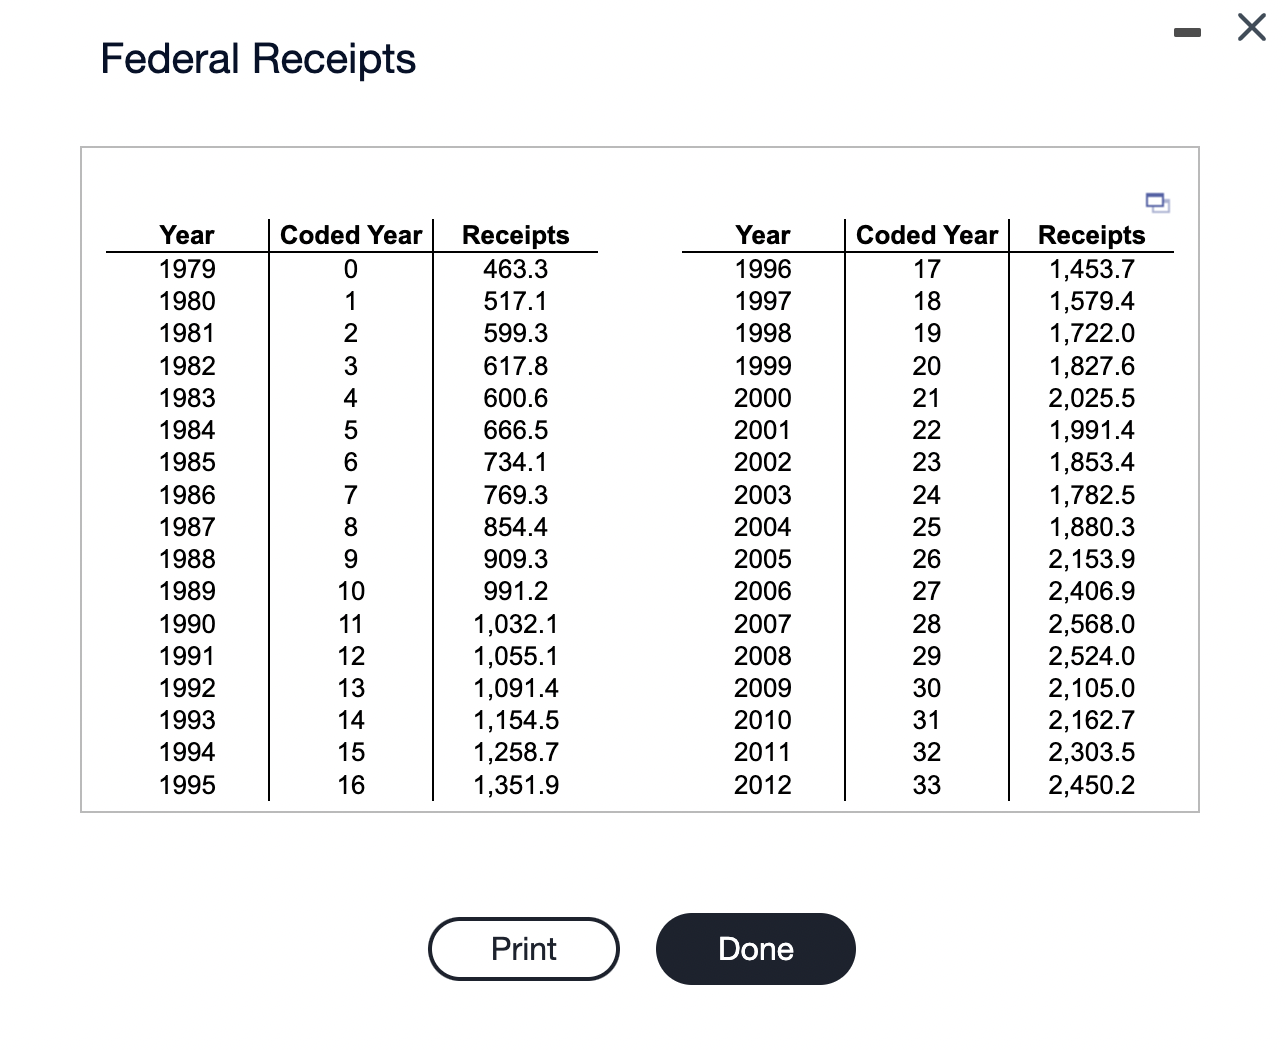
Question 1, 16.3.11 O HW Score: 0%, 0 of 3 points Part 1 of 5 O Points: 0 of 1 Save The linear trend forecasting equation for an annual time series containing 43 values (from 1962 to 2004) on net sales (in billions of dollars) is shown below. Complete (a) through (e) below. Y ; = 1.7 + 0.1X; . . . a. Intepret the Y-intercept, bo. Which statement below is the interpretation of the Y-intercept? O A. The Y-intercept bo = 1.7 indicates that sales are predicted to increase by $1.7 billion/year. O B. The Y-intercept bo = 1.7 reflects the predicted net sales in 1962. O C. The Y-intercept bo = 0.1 reflects the predicted net sales in 1962. O D. The Y-intercept bo = 0.1 indicates that sales are predicted to increase by $0.1 billion/year.T PR R RN A HW Score: 0%, 0 of 3 points ZU RN O Points: 0 of 1 Gross domestic product (GDP) is a major indicator of a nation's overall economic activity. It consists of personal consumption expenditures, gross domestic investment, net exports of goods and services, and government consumption expenditures. The GDP (in billions of current dollars) for the United States from 1982 to 2015 is shown in the accompanying data table. Complete (a) through (d) below. [ Click the icon to view the data table. a. Plot the data. Choose the correct graph below. N A. O B. O c. O D. Q 20,00 Q 20,000 Q 20,00 Q T T 2 z Q [=] Q Q - Q) Q) A Q =, w2 = s o o o o a 70 70 A0 A o [ 0 @ 0 & 0 & 0 0 0 0 35 0 35 0 35 Coded Year Coded Year Coded Year Coded Year \fQuestion 3, 16.3.14-T ) HW Score: 0%, 0 of 3 points EURRS QO Points: 0 of 1 2 The accompanying data table represents federal receipts from 1979 through 2012 in billions of current dollars, from - individual and corporate income tax, social insurance, excise tax, estate and gift tax, customs duties, and federal reserve deposits. Complete (a) through (d) below. FH Click the icon to view the data table. __ a. Plot the data. Choose the correct graph below. o P & & Receipts ($billions) Receipts ($billions) Receipts ($billions) Recepits ($billions) 0 0 0 Coded Year Coded Year Coded Year Coded Year Federal Receipts Year Coded Year Receipts 1979 1980 1981 1982 1983 1984 1985 1986 1987 1988 1989 1990 1991 1992 1993 1994 1995 o o~ WN-= 463.3 5171 599.3 617.8 600.6 666.5 7341 769.3 854.4 909.3 991.2 1,032.1 1,055.1 1,091.4 1,154.5 1,258.7 1,351.9 Year 1996 1997 1998 1999 2000 2001 2002 2003 2004 2005 2006 2007 2008 2009 2010 2011 2012 Coded Year 17 18 19 20 21 22 23 24 25 26 27 28 29 30 31 32 33 Receipts 1,453.7 1,579.4 1,722.0 1,827.6 2,025.5 1,991.4 1,853.4 1,782.5 1,880.3 2,153.9 2,406.9 2,568.0 2,524.0 2,105.0 2,162.7 2,303.5 2,450.2 o
Step by Step Solution
There are 3 Steps involved in it
Step: 1
Get Instant Access to Expert-Tailored Solutions
See step-by-step solutions with expert insights and AI powered tools for academic success
Step: 2
Step: 3
Ace Your Homework with AI
Get the answers you need in no time with our AI-driven, step-by-step assistance