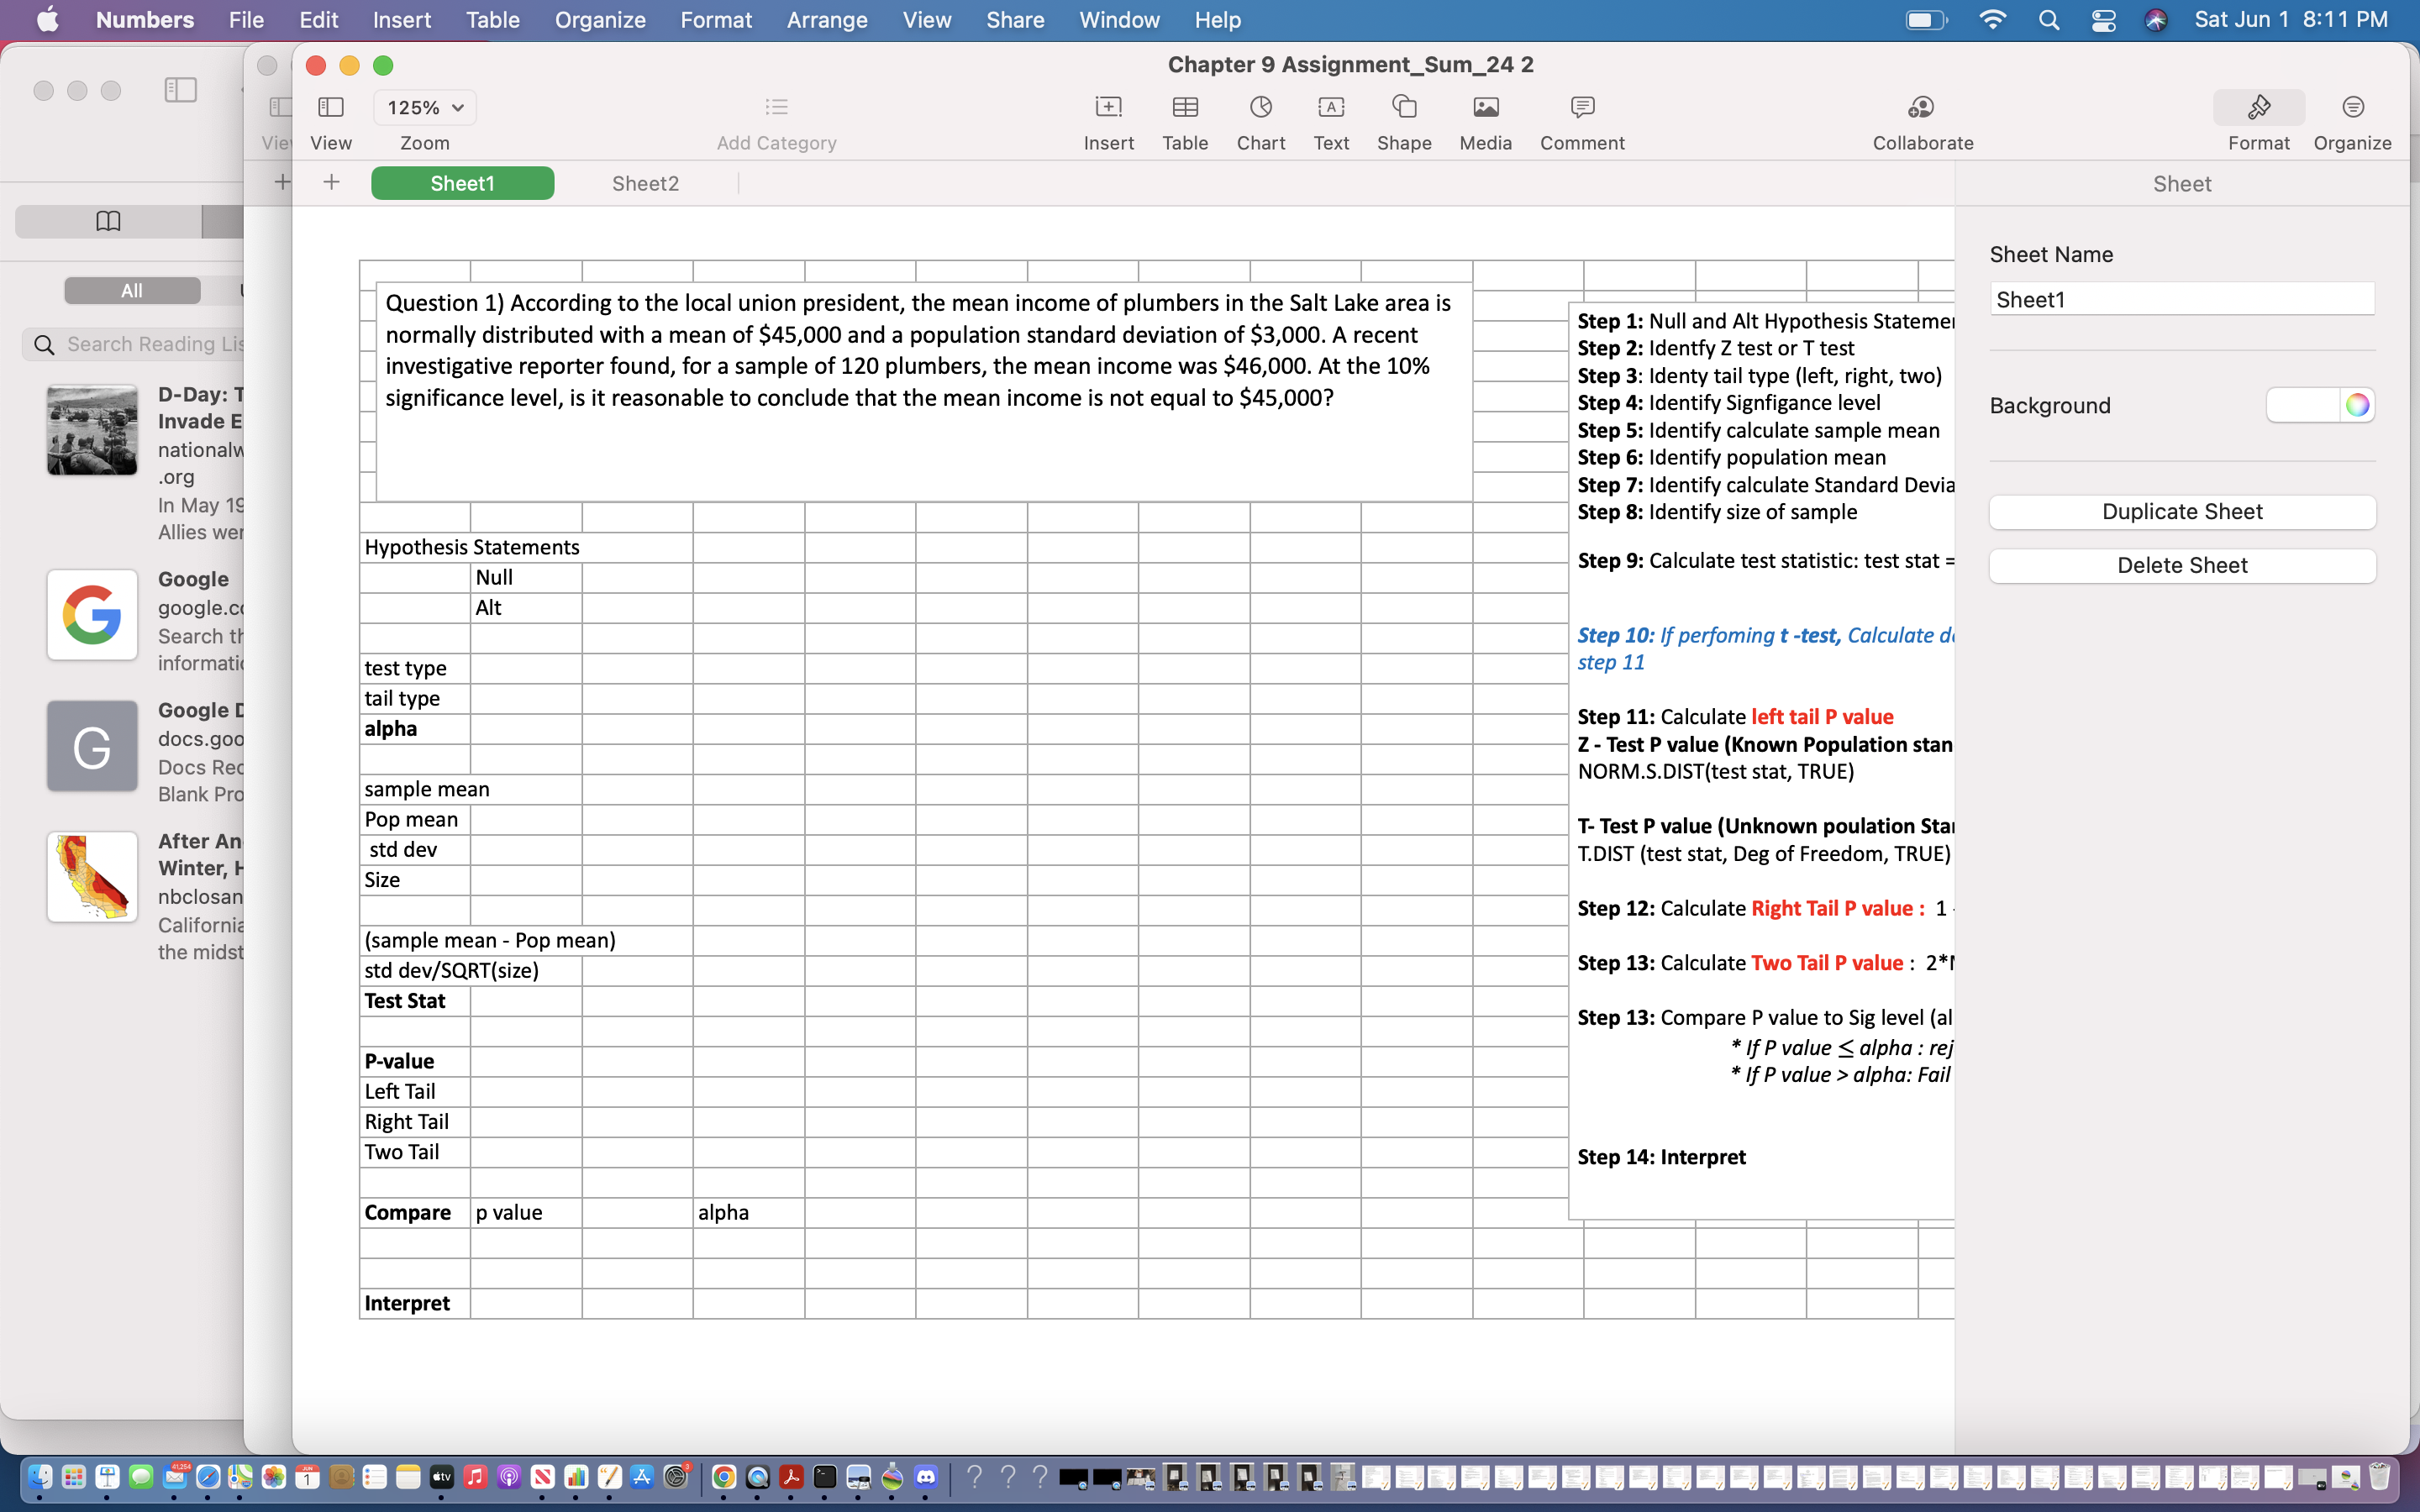
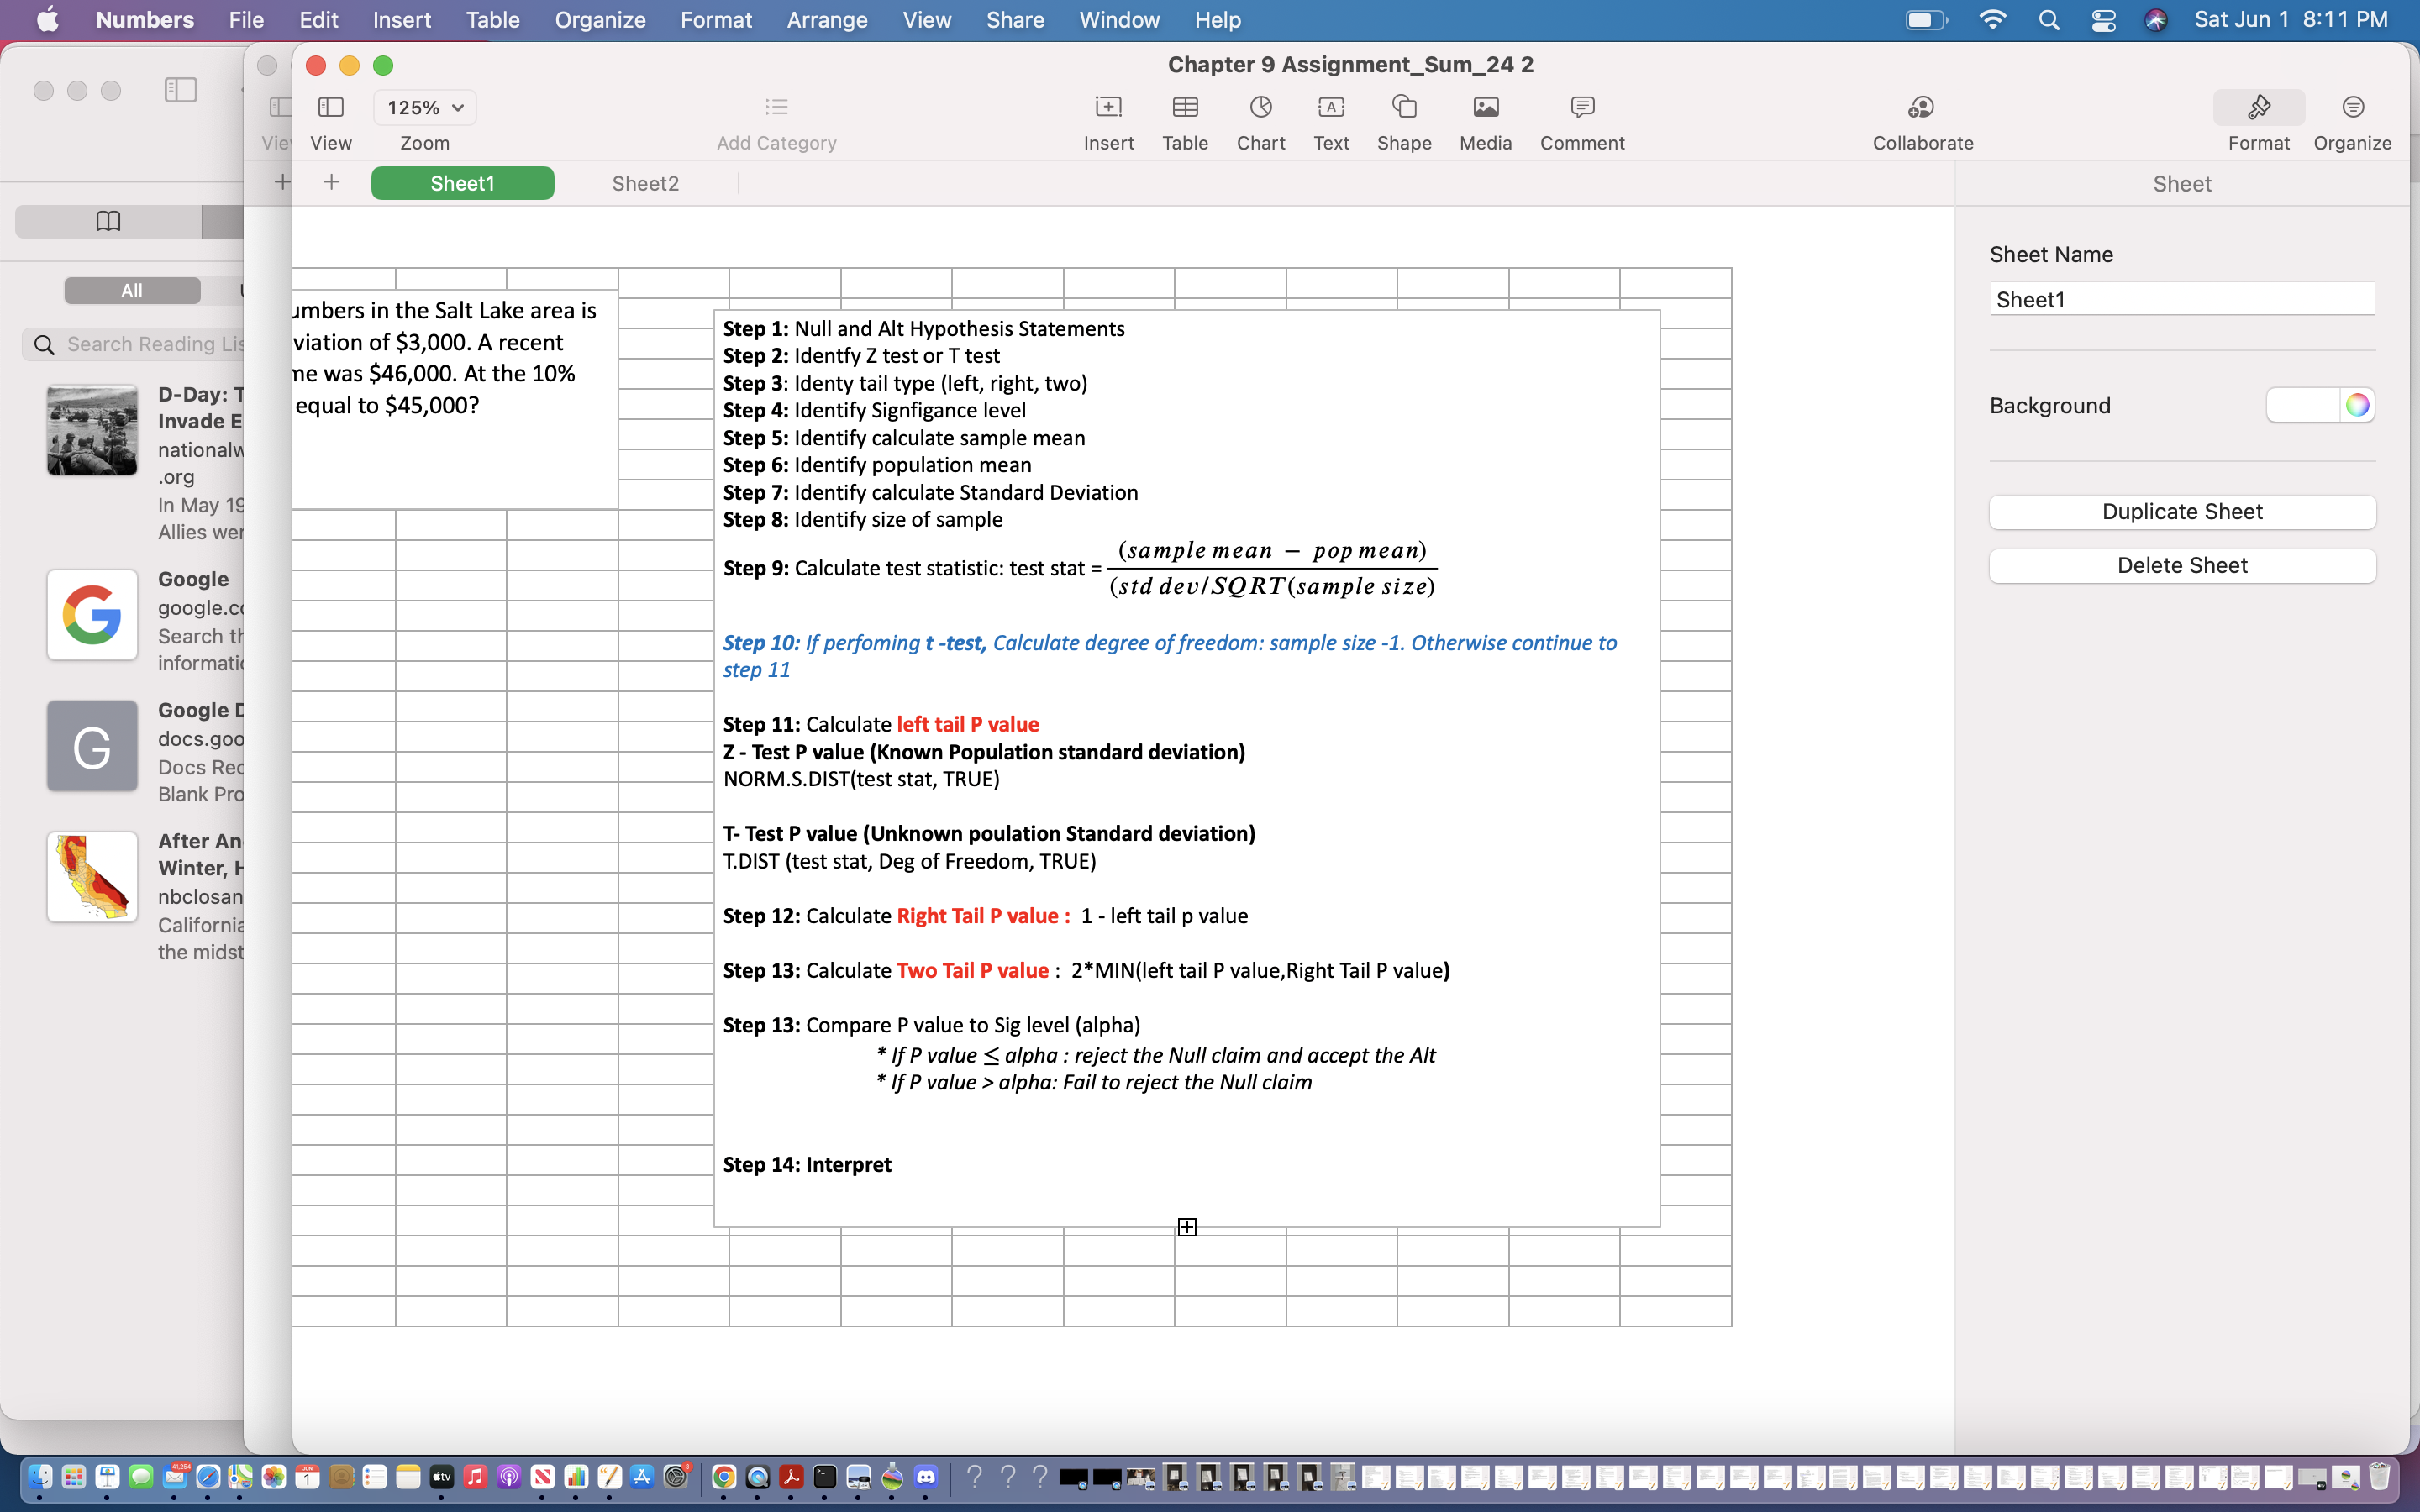
Question 1) According to the local union president, the mean income of plumbers in the Salt Lake area is normally distributed with a mean of
Question 1) According to the local union president, the mean income of plumbers in the Salt Lake area is normally distributed with a mean of $45,000 and a population standard deviation of $3,000. A recent investigative reporter found, for a sample of 120 plumbers, the mean income was $46,000. At the 10% significance level, is it reasonable to conclude that the mean income is not equal to $45,000?
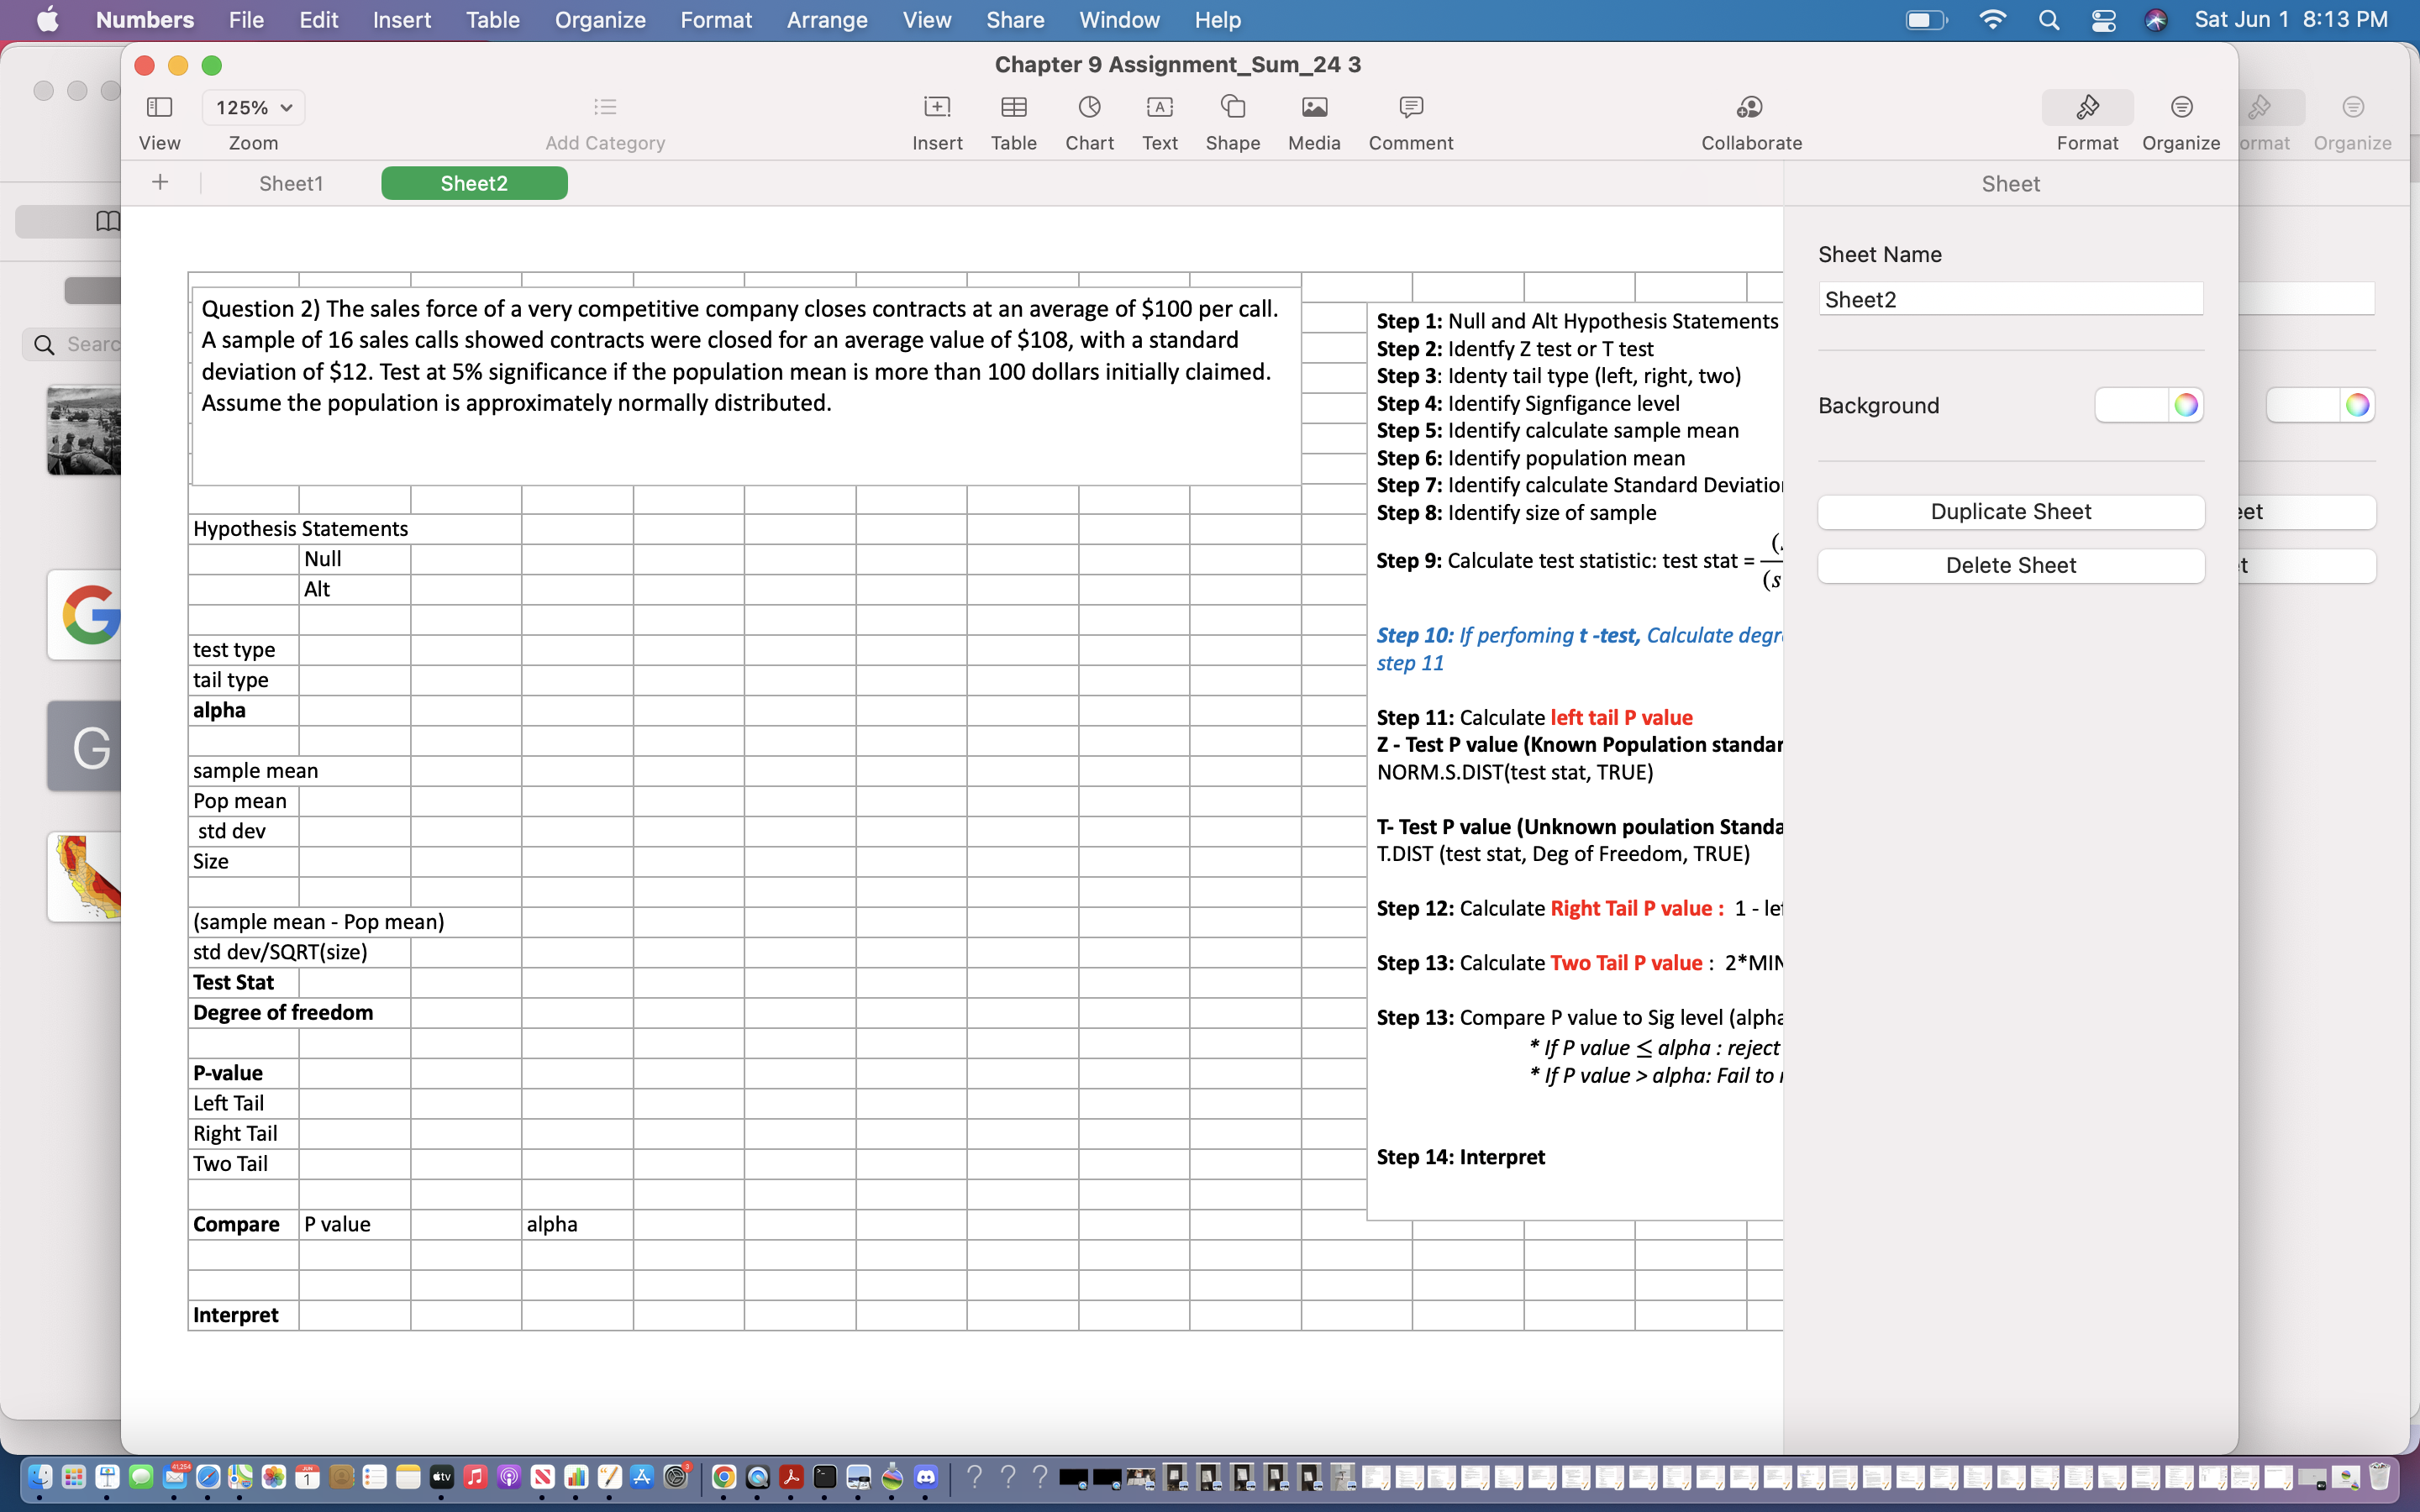
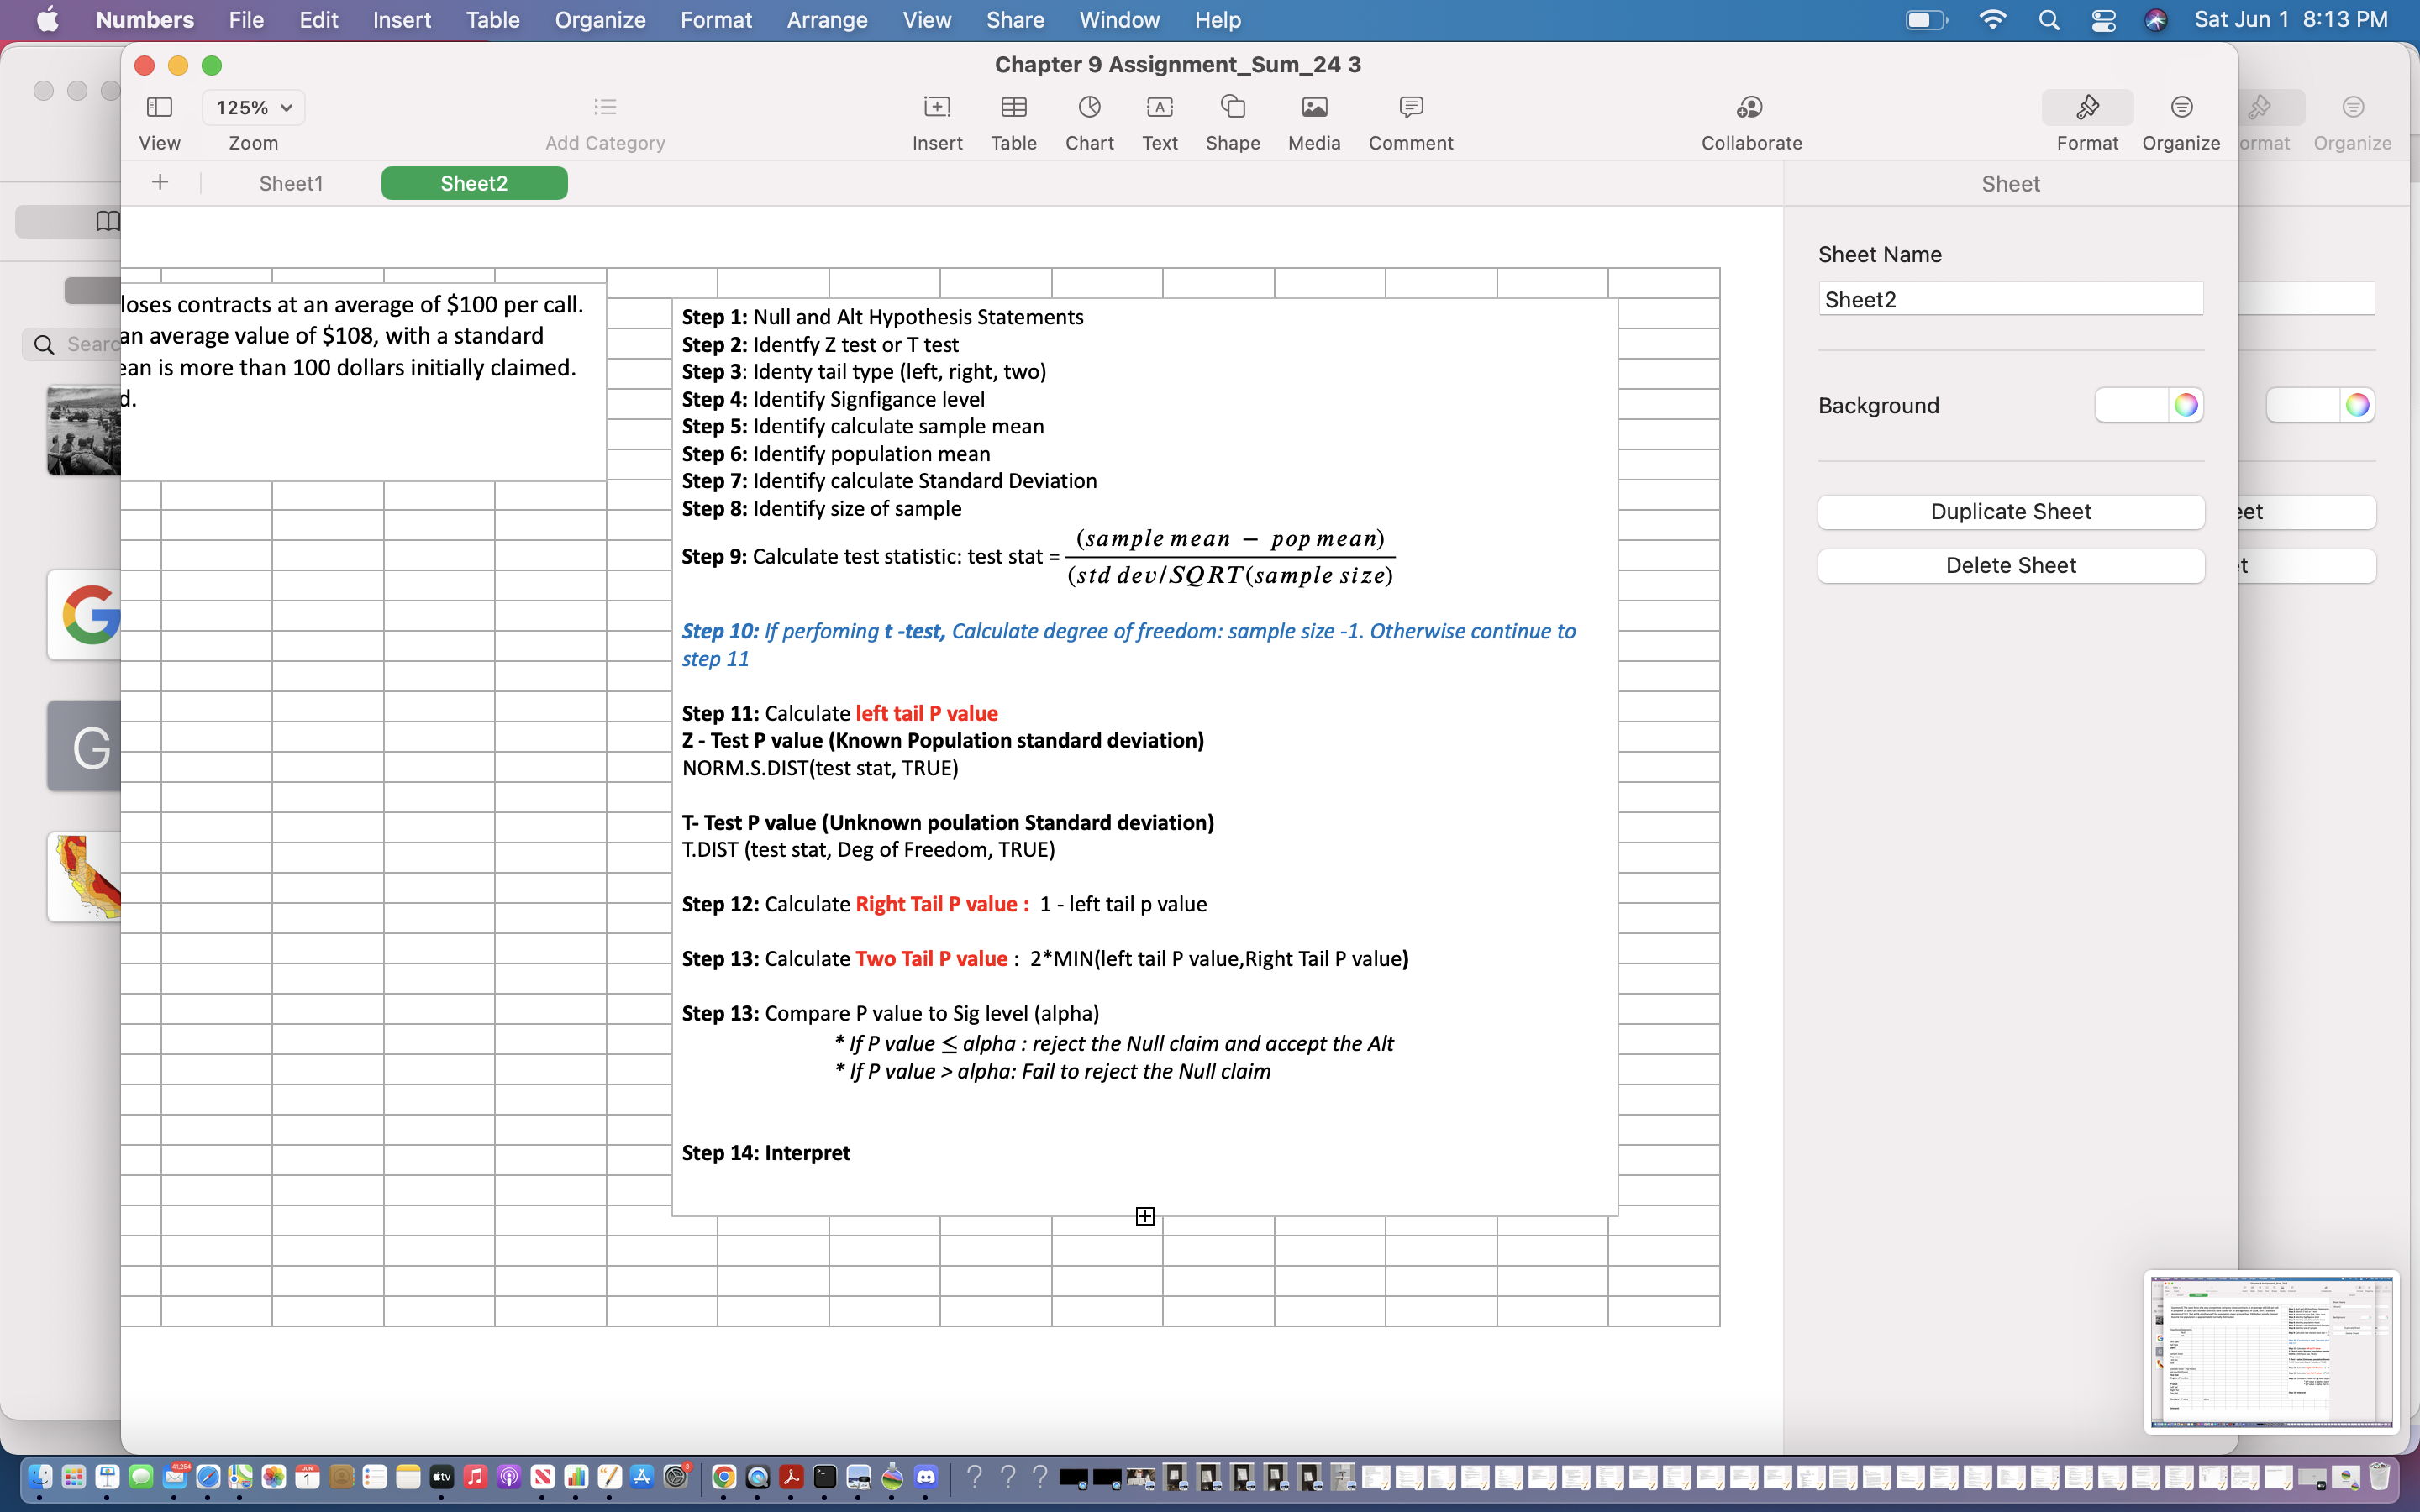
Numbers File Edit Insert Table Organize Format Arrange View Share Window Help Q g Sat Jun 1 8:11 PM Chapter 9 Assignment_Sum_24 2 125% i+ A Vie Zoom Add Category Insert Table Chart Text Shape Media Comment Collaborate Format Organize + + Sheet1 Sheet2 Sheet Sheet Name All Question 1) According to the local union president, the mean income of plumbers in the Salt Lake area is Sheet1 normally distributed with a mean of $45,000 and a population standard deviation of $3,000. A recent Step 1: Null and Alt Hypothesis Statemel Q Search Reading Lis Step 2: Identfy Z test or T test investigative reporter found, for a sample of 120 plumbers, the mean income was $46,000. At the 10% Step 3: Identy tail type (left, right, two) D-Day: T significance level, is it reasonable to conclude that the mean income is not equal to $45,000? Step 4: Identify Signfigance leve Background O Invade E Step 5: Identify calculate sample mean nationalw Step 6: Identify population mean .org Step 7: Identify calculate Standard Devia In May 19 Step 8: Identify size of sample Duplicate Sheet Allies wer Hypothesis Statements Step 9: Calculate test statistic: test stat = Delete Sheet Google Null C google.c Alt Search th Step 10: If perfoming t -test, Calculate d informatic test type step 11 Google [ tail type Step 11: Calculate left tail P value docs.goo alpha C Z - Test P value (Known Population stan Docs Red NORM.S.DIST(test stat, TRUE Blank Pro sample mean Pop mean T- Test P value (Unknown poulation Stal After An std dev T.DIST (test stat, Deg of Freedom, TRUE) Winter, Size nbclosan Step 12: Calculate Right Tail P value : 1 California the midst (sample mean - Pop mean) std dev/SQRT(size) Step 13: Calculate Two Tail P value : 2*[ Test Stat Step 13: Compare P value to Sig level (al P-value If P value alpha: Fail Left Tail Right Tail Two Tail Step 14: Interpret Compare p value alpha InterpretNumbers File Edit Insert Table Organize Format Arrange View Share Window Help Q g Sat Jun 1 8:11 PM . . Chapter 9 Assignment_Sum_24 2 125% A Vie Zoom Add Category Insert Table Chart Text Shape Media Comment Collaborate Format Organize + + Sheet1 Sheet2 Sheet Sheet Name All Sheet1 umbers in the Salt Lake area is Q Search Reading Lis viation of $3,000. A recent Step 1: Null and Alt Hypothesis Statements ne was $46,000. At the 10% Step 2: Identfy Z test or T test D-Day: T Step 3: Identy tail type (left, right, two) equal to $45,000? Step 4: Identify Signfigance level Background O Invade E nationalw Step 5: Identify calculate sample mean .org Step 6: Identify population mean In May 19 Step 7: Identify calculate Standard Deviation Step 8: Identify size of sample Duplicate Sheet Allies wer (sample mean - pop mean) Google Step 9: Calculate test statistic: test stat = - Delete She std dev/SQRT(sample size) C google.c Search th Step 10: If perfoming t -test, Calculate degree of freedom: sample size -1. Otherwise continue to informatic step 11 Google [ docs.goo Step 11: Calculate left tail P value C Z - Test P value (Known Population standard deviation) Docs Red NORM.S.DIST(test stat, TRUE Blank Pro After An T- Test P value (Unknown poulation Standard deviation) Winter, T.DIST (test stat, Deg of Freedom, TRUE) nbclosan California Step 12: Calculate Right Tail P value : 1 - left tail p value the midst Step 13: Calculate Two Tail P value : 2*MIN(left tail P value, Right Tail P value) Step 13: Compare P value to Sig level (alpha) *If P value alpha: Fail to reject the Null claim Step 14: InterpretNumbers File Edit Insert Table Organize Format Arrange View Share Window Help Q 8 Sat Jun 1 8:13 PM OOO Chapter 9 Assignment_Sum_24 3 125% A View Zoom Add Category Insert Table Chart Text Shape Media Comment Collaborate Format Organize format Organize Sheet1 Sheet2 Sheet LL Sheet Name Question 2) The sales force of a very competitive company closes contracts at an average of $100 per call. Sheet2 Step 1: Null and Alt Hypothesis Statements Q A sample of 16 sales calls showed contracts were closed for an average value of $108, with a standard Step 2: Identfy Z test or T test deviation of $12. Test at 5% significance if the population mean is more than 100 dollars initially claimed. Step 3: Identy tail type (left, right, two) Assume the population is approximately normally distributed. Step 4: Identify Signfigance level Background O Step 5: Identify calculate sample mean Step 6: Identify population mean Step 7: Identify calculate Standard Deviation Step 8: Identify size of sample Duplicate Sheet et Hypothesis Statements Null Step 9: Calculate test statistic: test stat = - (s Delete Sheet Alt C Step 10: If perfoming t -test, Calculate degr test type step 11 tail type alpha Step 11: Calculate left tail P value Z - Test P value (Known Population standar sample mean NORM.S.DIST(test stat, TRUE) Pop mean std dev T- Test P value (Unknown poulation Standa Size T.DIST (test stat, Deg of Freedom, TRUE) (sample mean - Pop mean) Step 12: Calculate Right Tail P value : 1 - let std dev/SQRT(size) Step 13: Calculate Two Tail P value : 2*MIN Test Stat Degree of freedom Step 13: Compare P value to Sig level (alpha * If P value alpha: Fail to Left Tail Right Tail Two Tail Step 14: Interpret Compare P value alpha InterpretNumbers File Edit Insert Table Organize Format Arrange View Share Window Help Q 8 Sat Jun 1 8:13 PM OOO Chapter 9 Assignment_Sum_24 3 125% EB A View Zoom Add Category Insert Table Chart Text Shape Media Comment Collaborate Format Organize format Organize Sheet1 Sheet2 Sheet Sheet Name oses contracts at an average of $100 per call. Sheet2 Step 1: Null and Alt Hypothesis Statements Q Searcan average value of $108, with a standard Step 2: Identfy Z test or T test an is more than 100 dollars initially claimed. Step 3: Identy tail type (left, right, two) Step 4: Identify Signfiga Background Step 5: Identify calculate sample mean Step 6: Identify population mean Step 7: Identify calculate Standard Deviation Step 8: Identify size of sample Duplicate Sheet et Step 9: Calculate test statistic: test stat = (sample mean - pop mean) (std devlSQRT(sample size) Delete Sheet C Step 10: If perfoming t -test, Calculate degree of freedom: sample size -1. Otherwise continue to step 11 Step 11: Calculate left tail P value G Z - Test P value (Known Population standard deviation) NORM.S.DIST(test stat, TRUE) T- Test P value (Unknown poulation Standard deviation) T.DIST (test stat, Deg of Freedom, TRUE) Step 12: Calculate Right Tail P value : 1 - left tail p value Step 13: Calculate Two Tail P value : 2*MIN(left tail P value, Rig Step 13: Compare P value to Sig level (alpha) * If P value _ alpha : reject the Null claim and accept the Alt * If P value > alpha: Fail to reject the Null claim Step 14: Interpret
Step by Step Solution
There are 3 Steps involved in it
Step: 1
Get Instant Access to Expert-Tailored Solutions
See step-by-step solutions with expert insights and AI powered tools for academic success
Step: 2
Step: 3
Ace Your Homework with AI
Get the answers you need in no time with our AI-driven, step-by-step assistance