Answered step by step
Verified Expert Solution
Question
1 Approved Answer
Develop a production plan and calculate the annual cost for a firm whose demand forecast is fall, 10,200; winter, 7,700; spring, 6,700; summer, 12,200.
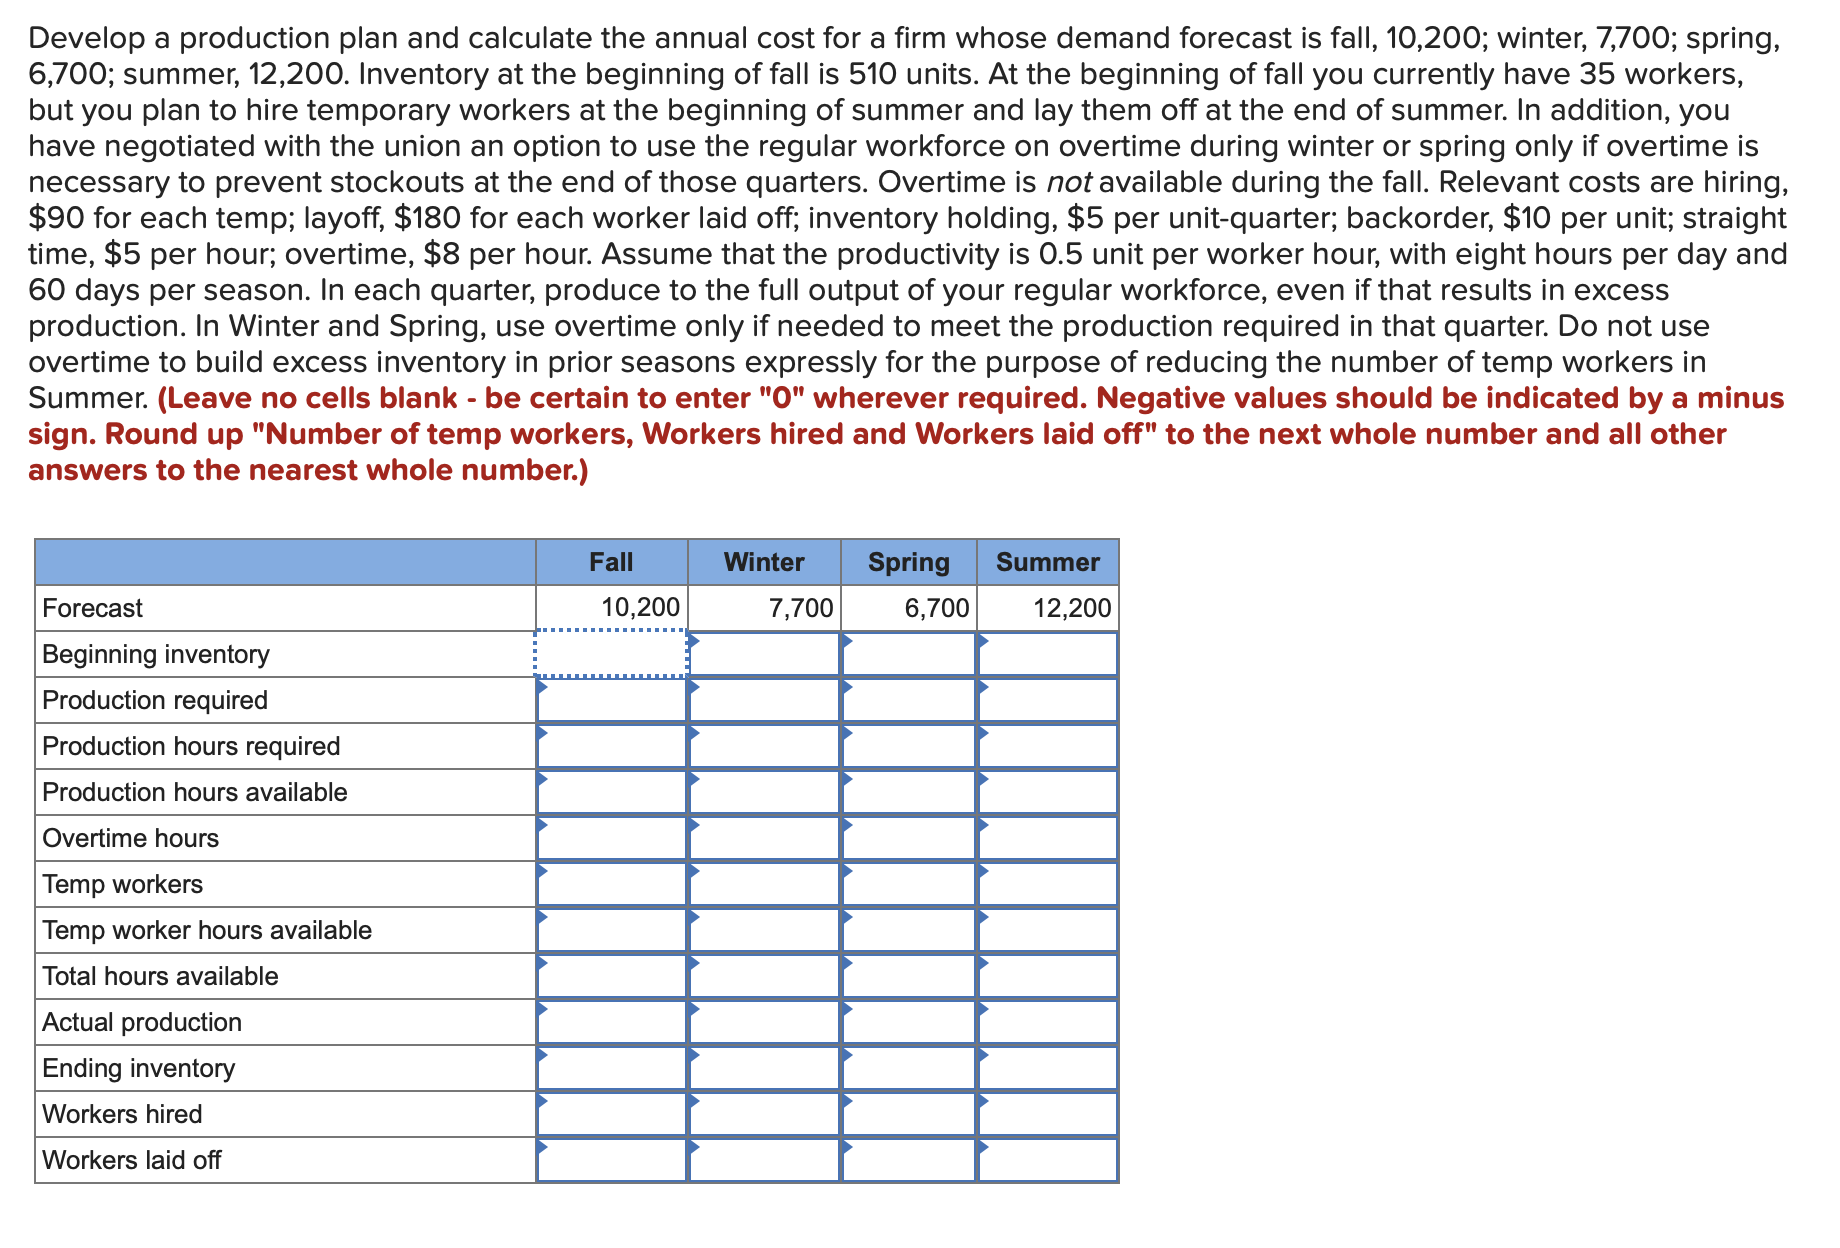
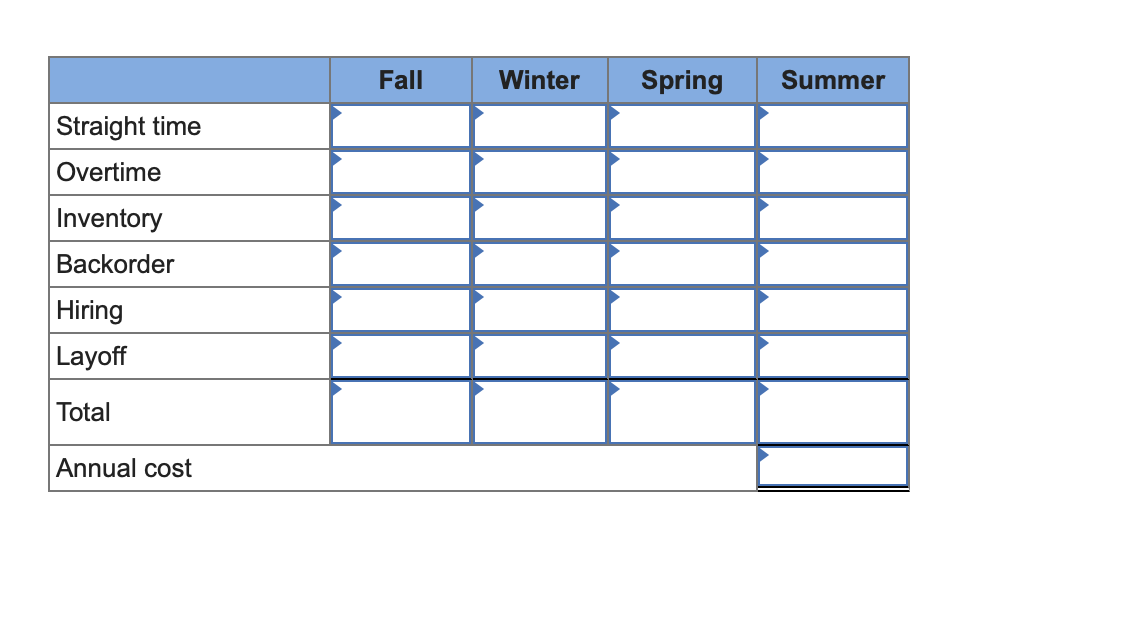
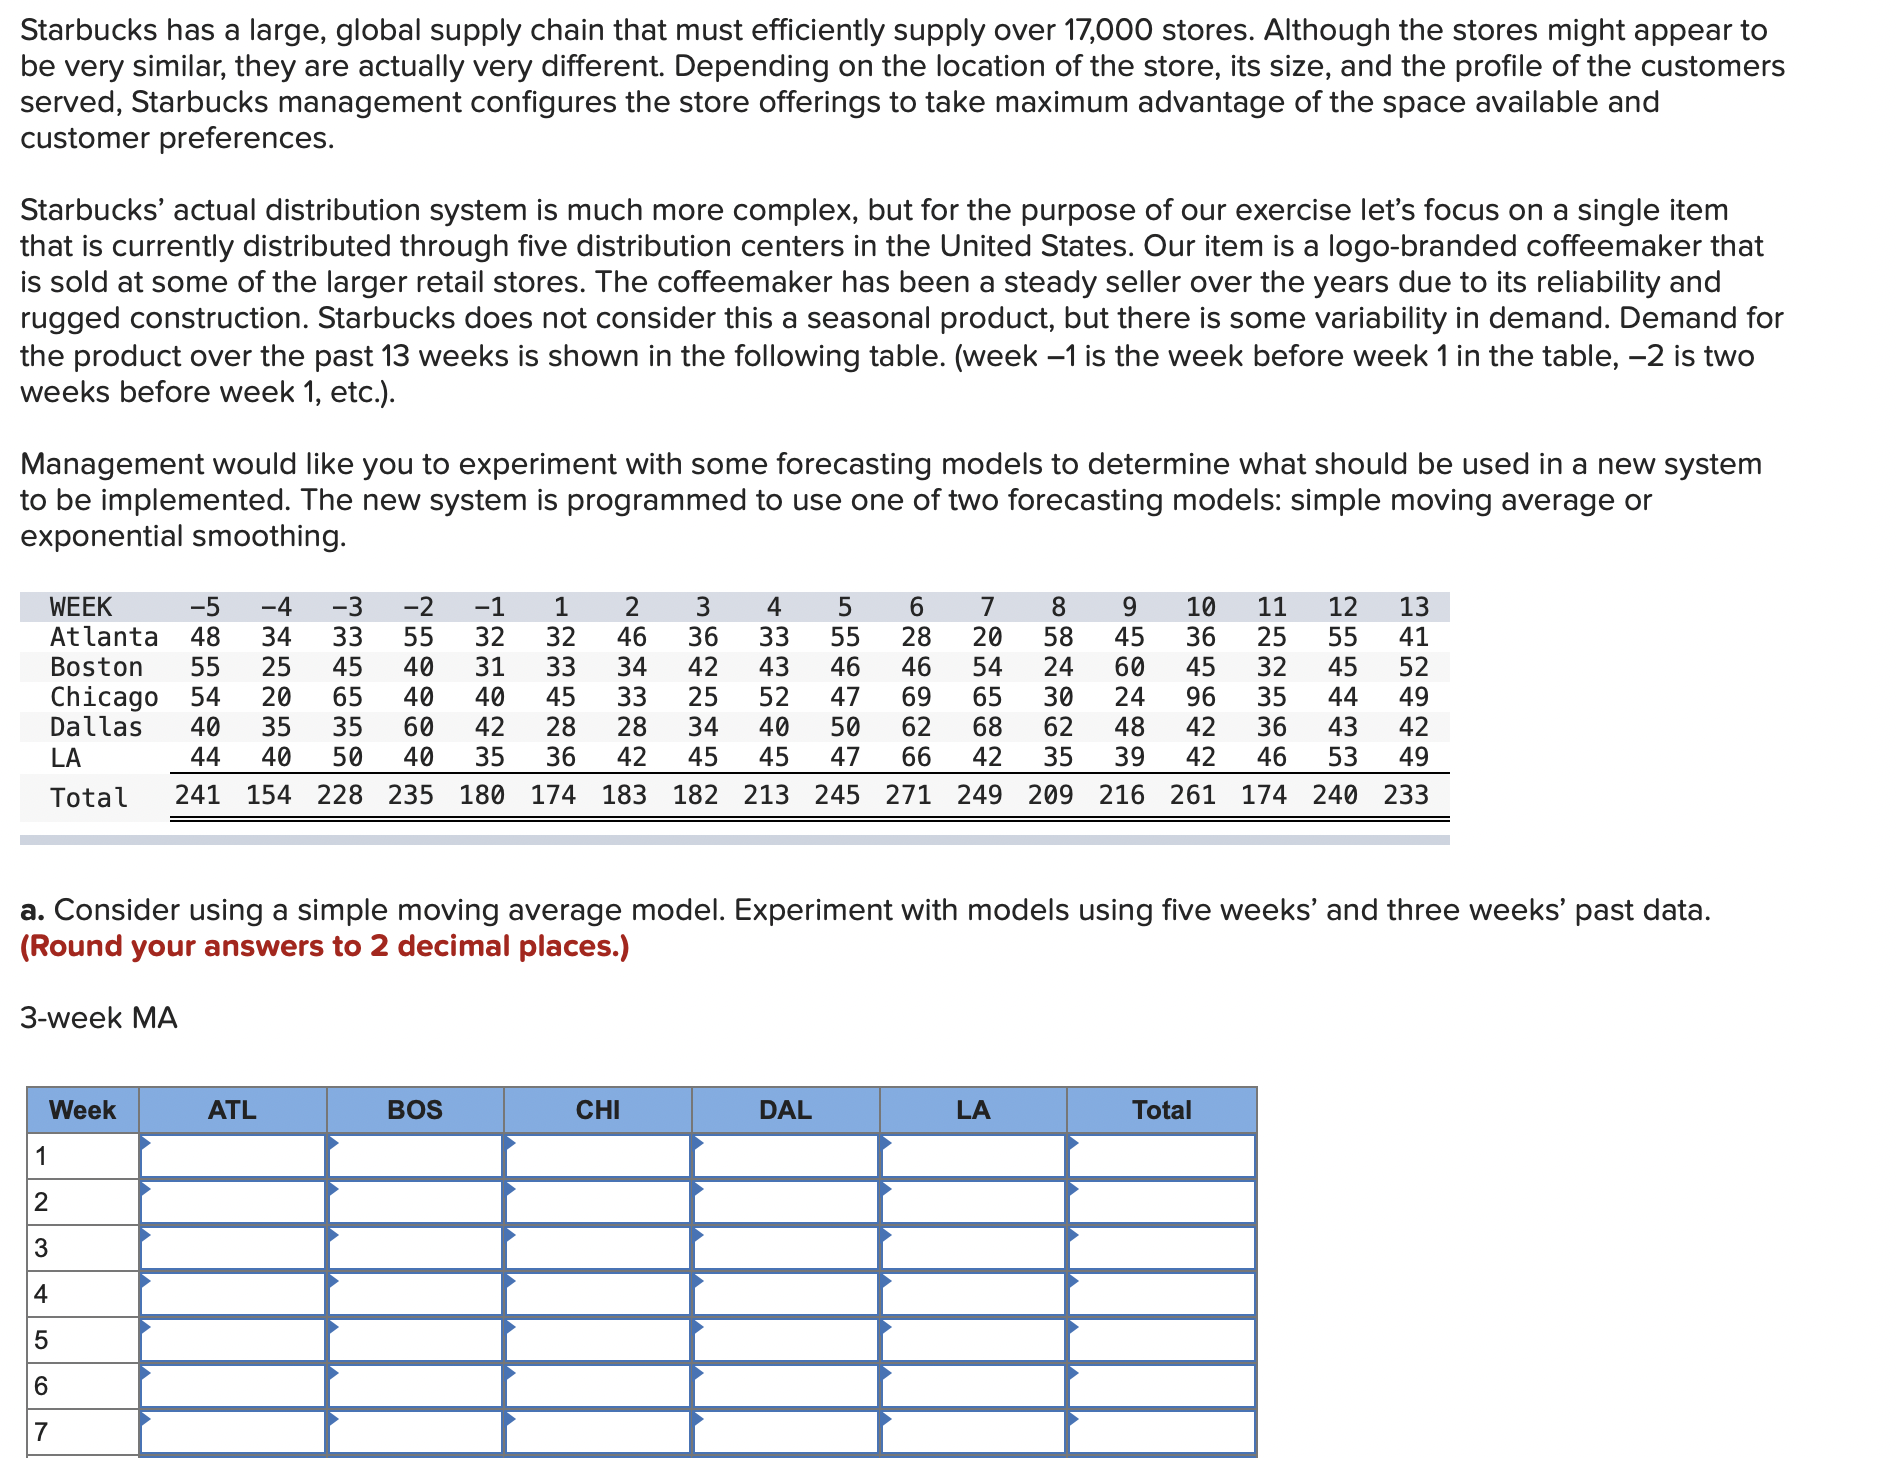
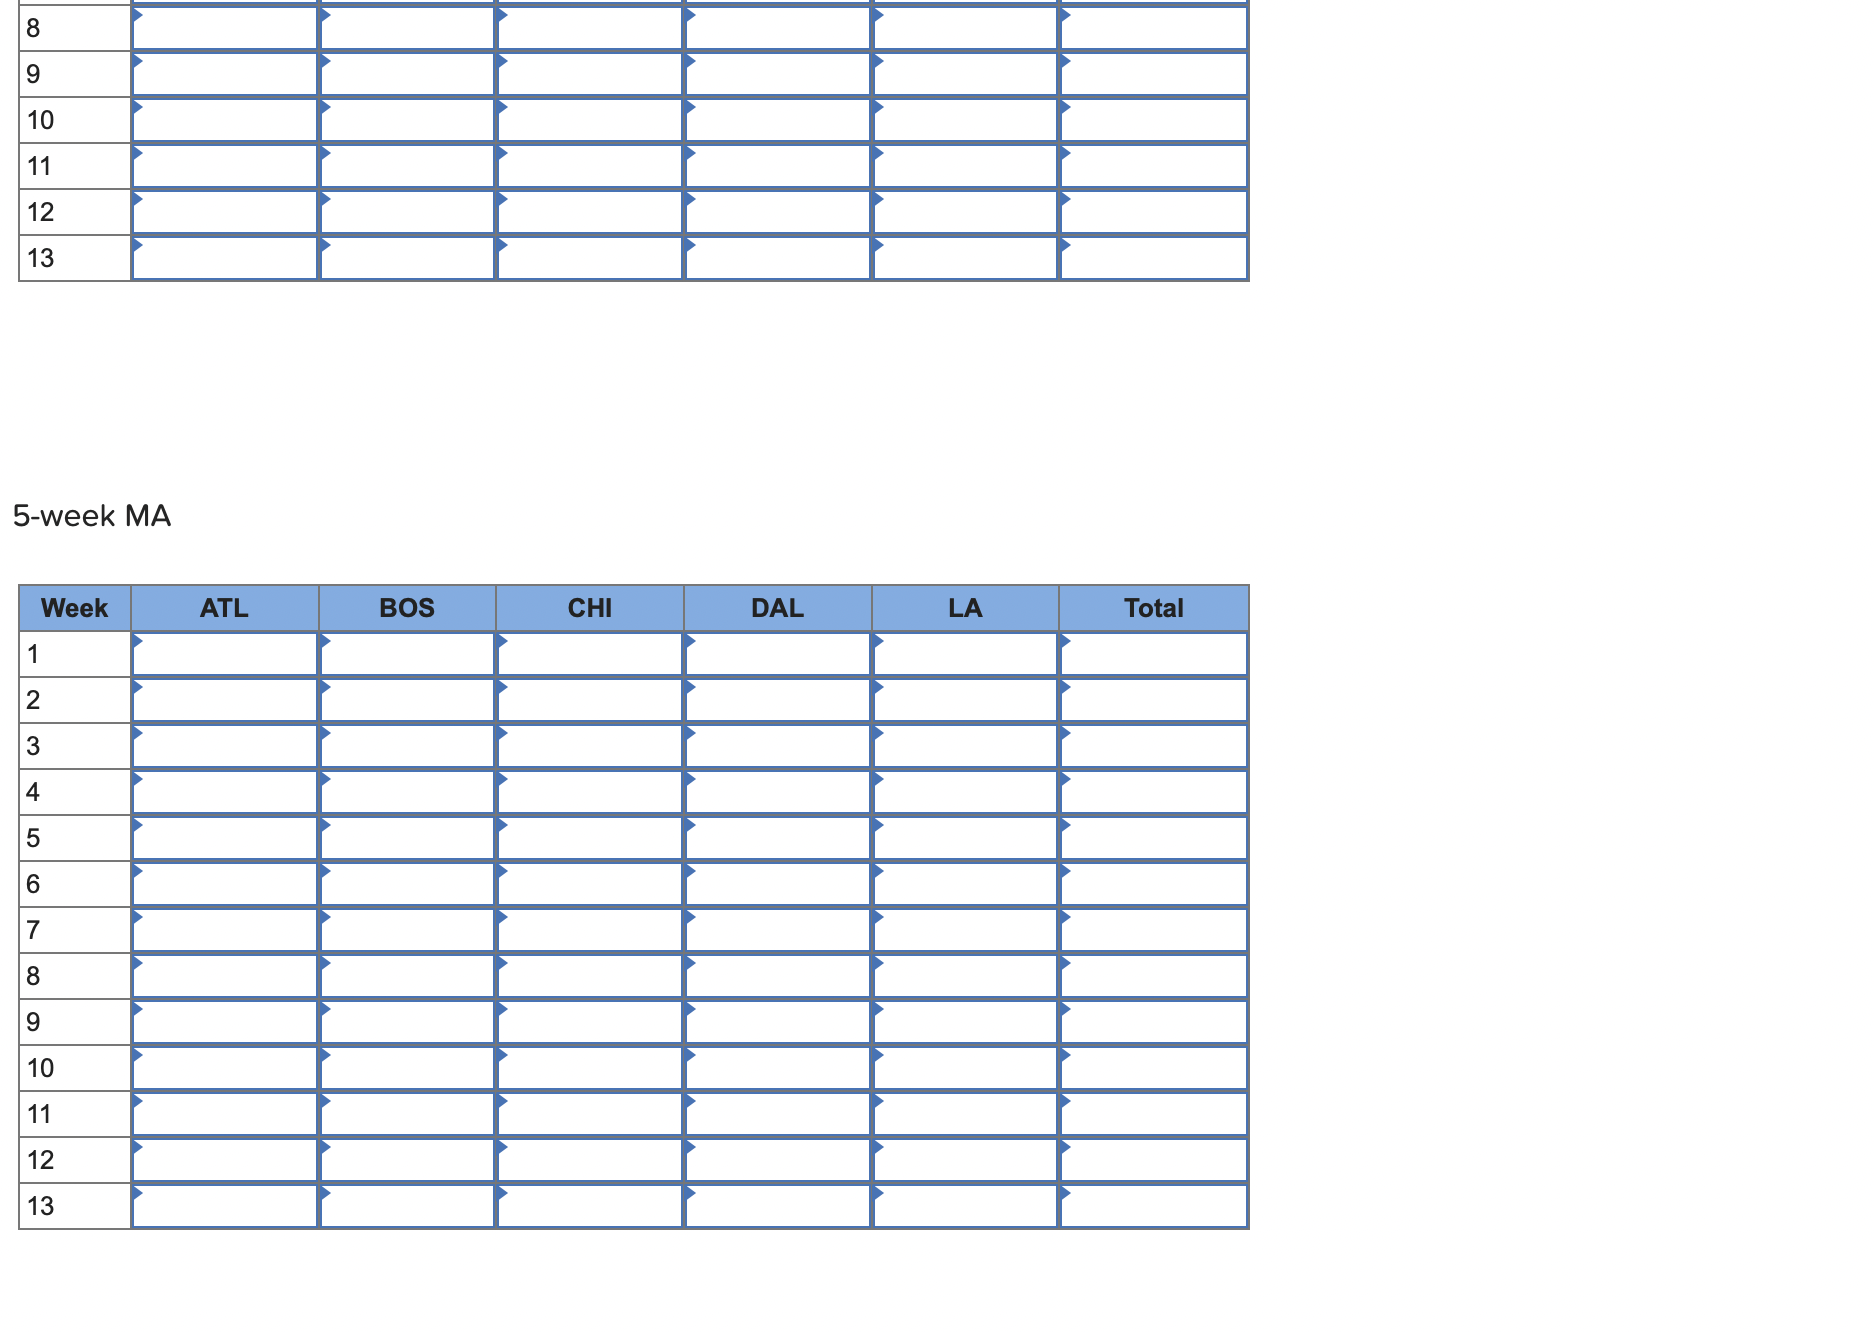
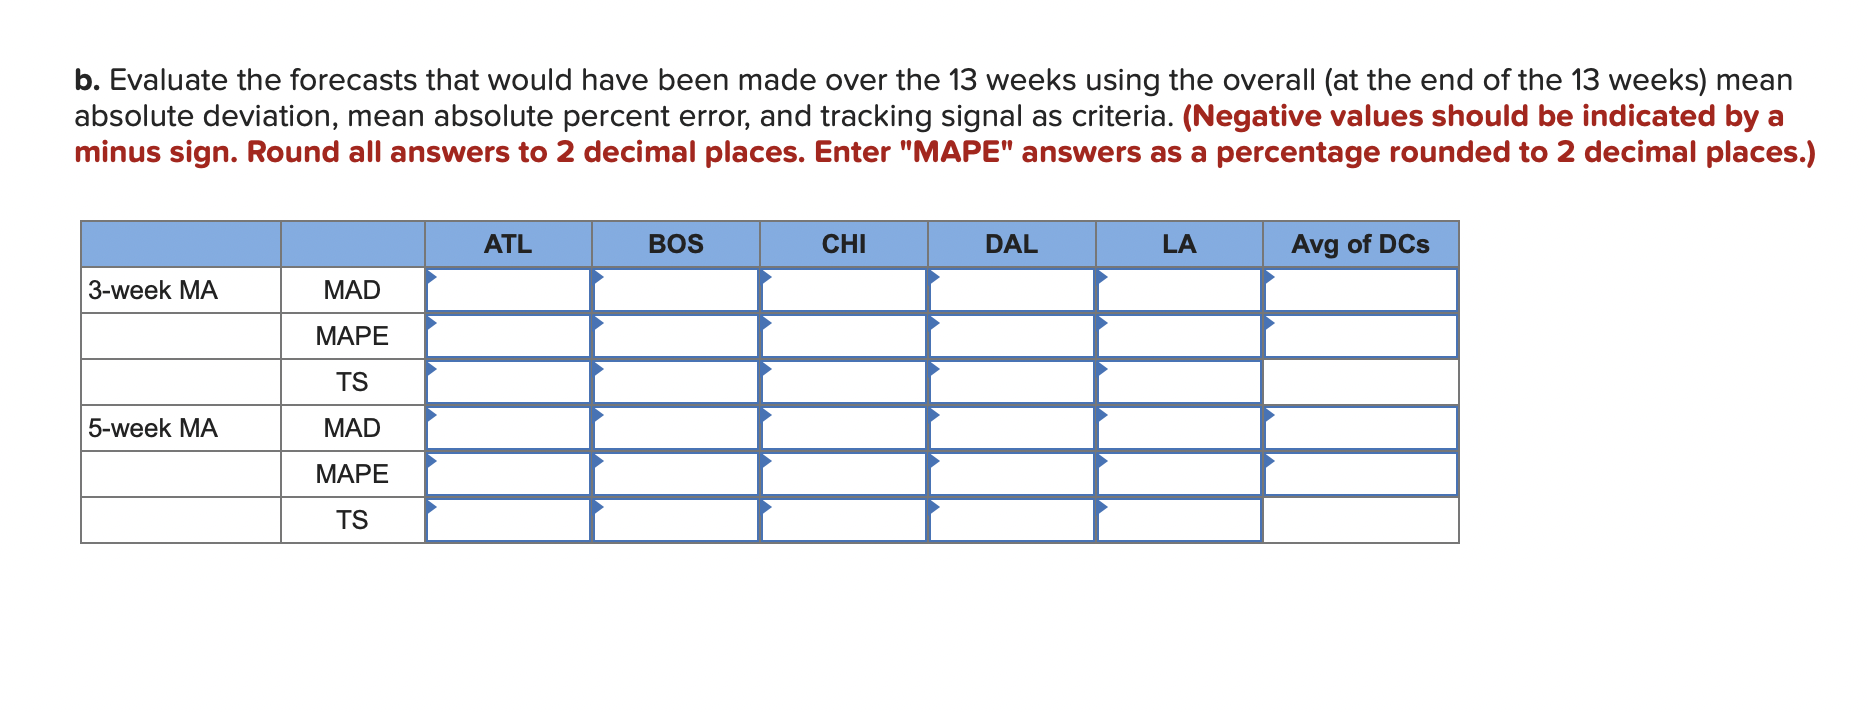

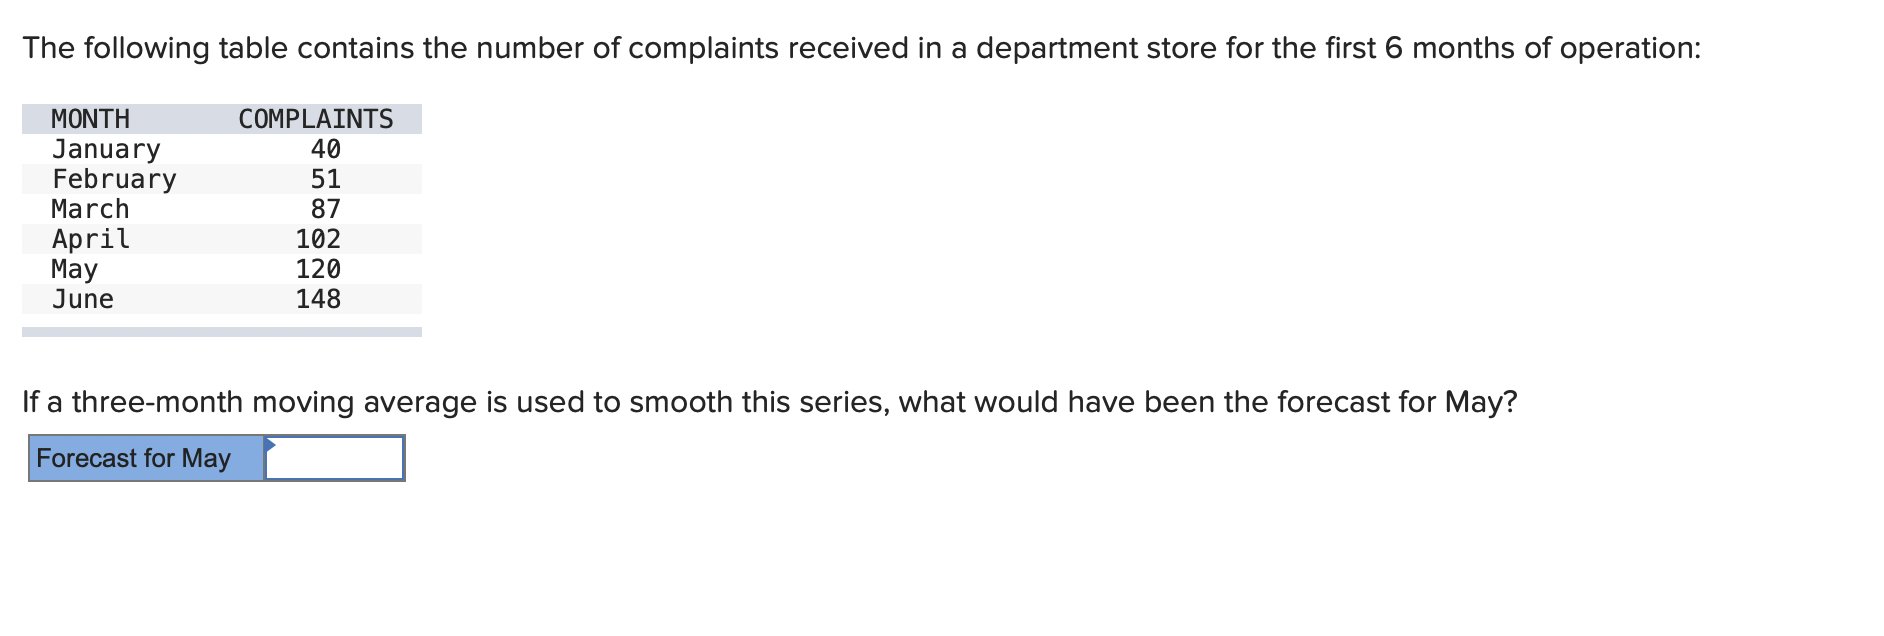
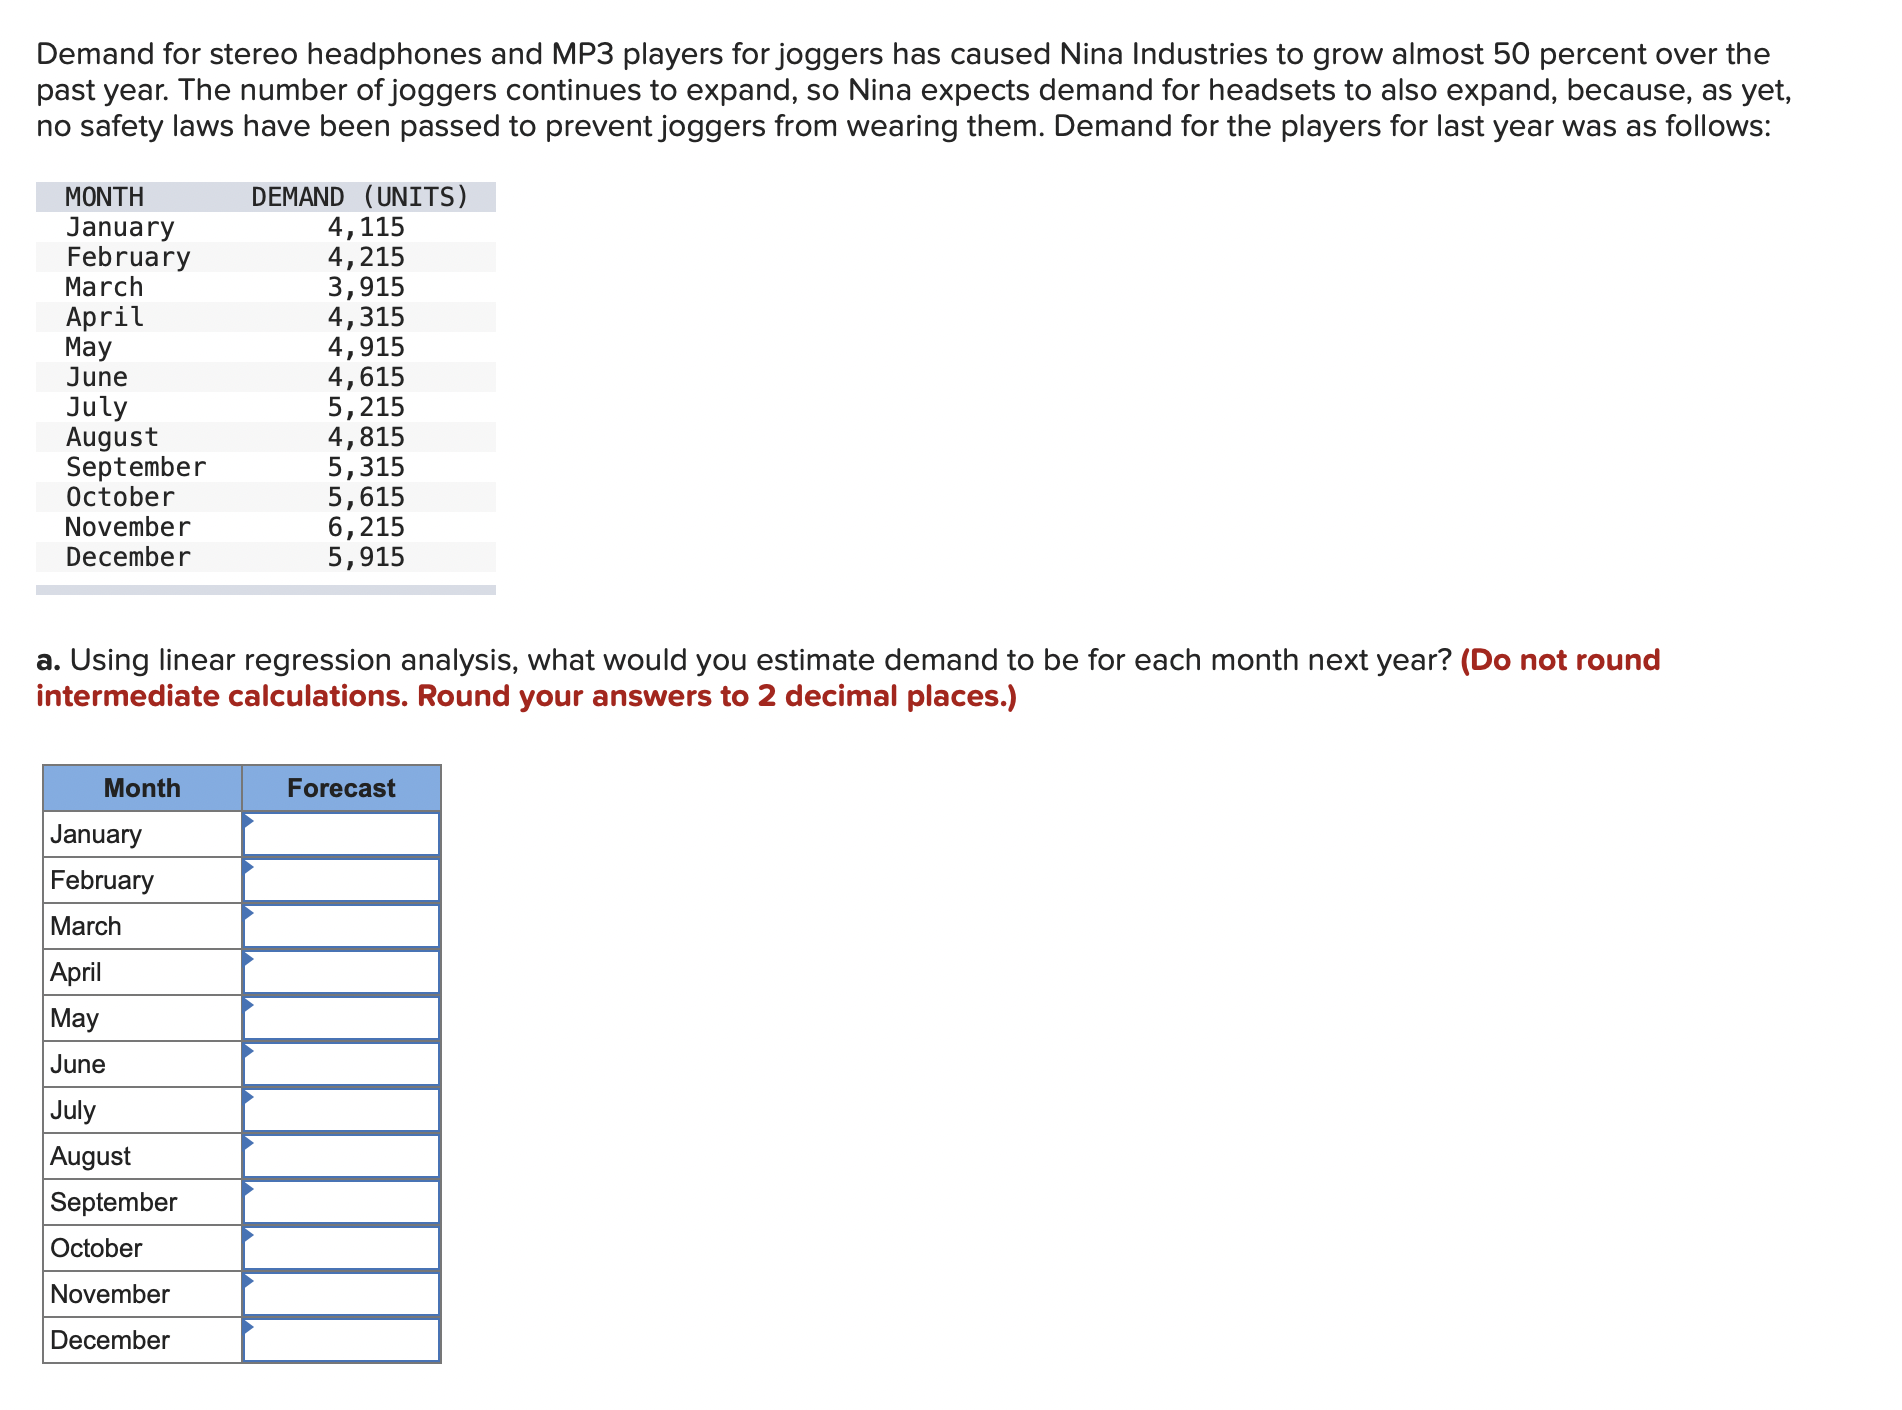

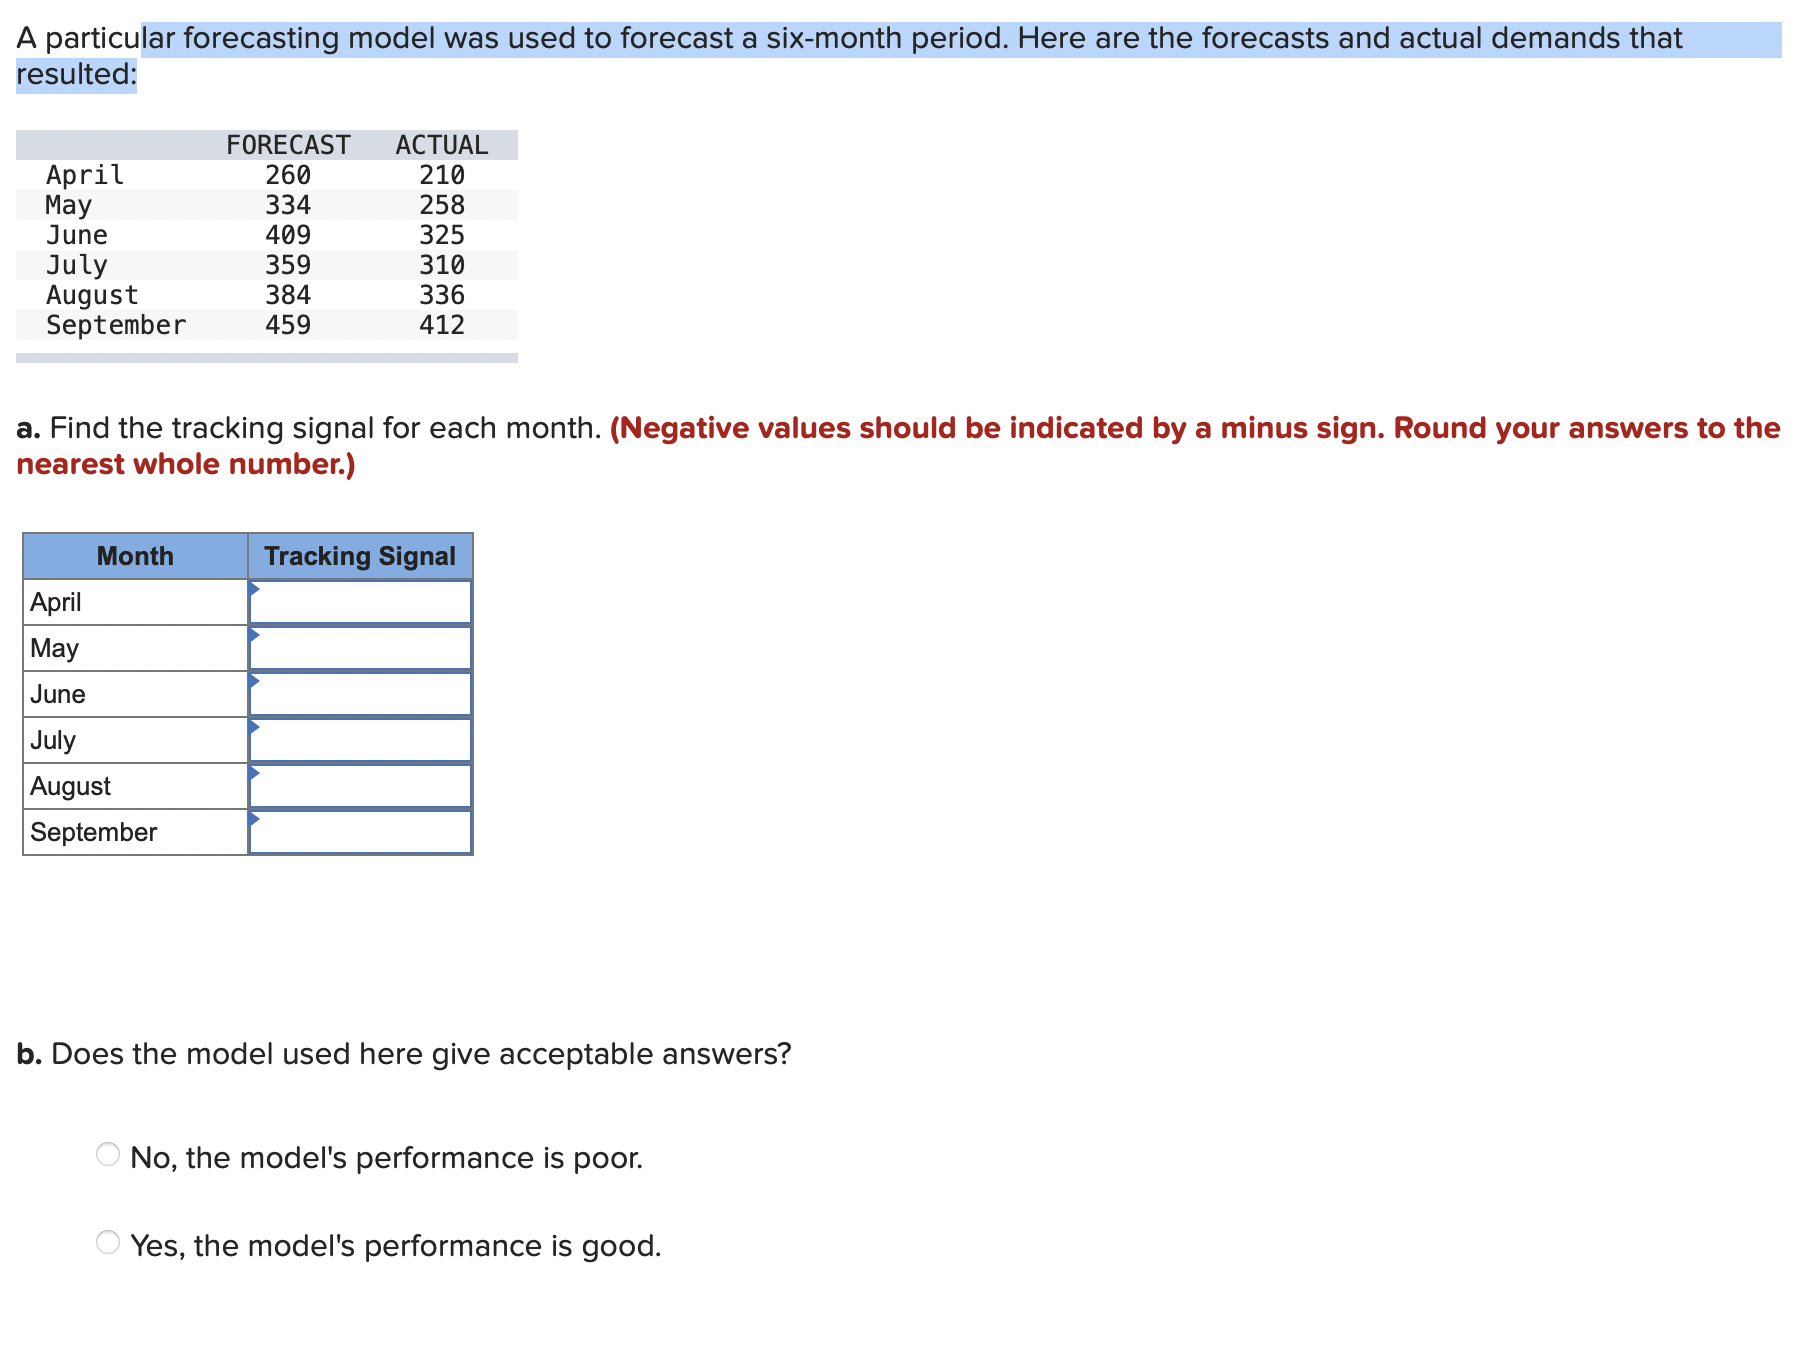
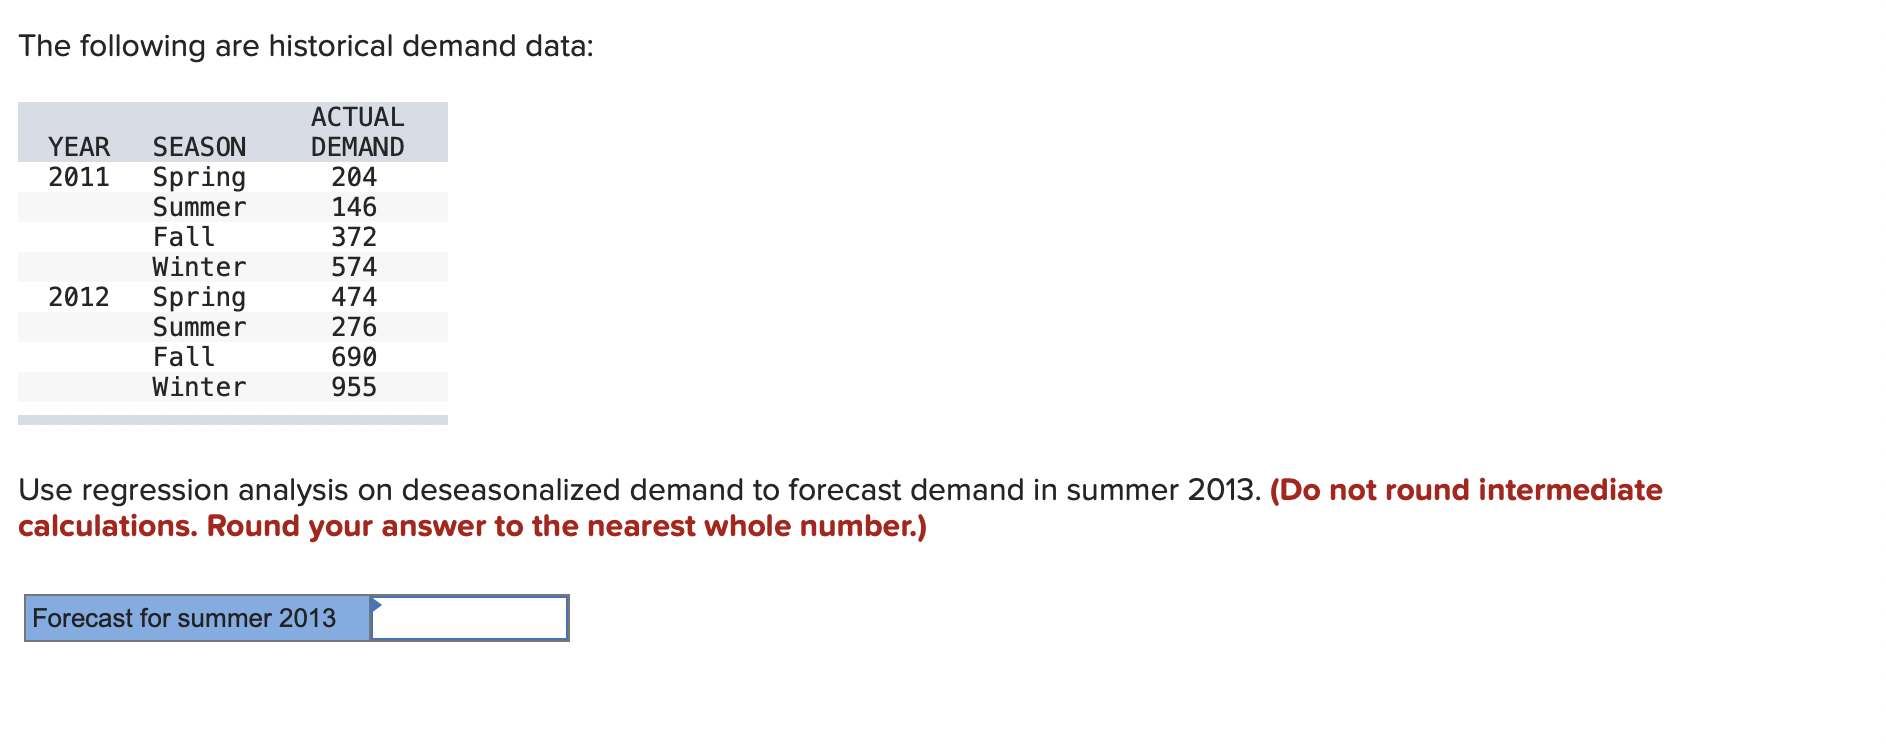
Develop a production plan and calculate the annual cost for a firm whose demand forecast is fall, 10,200; winter, 7,700; spring, 6,700; summer, 12,200. Inventory at the beginning of fall is 510 units. At the beginning of fall you currently have 35 workers, but you plan to hire temporary workers at the beginning of summer and lay them off at the end of summer. In addition, you have negotiated with the union an option to use the regular workforce on overtime during winter or spring only if overtime is necessary to prevent stockouts at the end of those quarters. Overtime is not available during the fall. Relevant costs are hiring, $90 for each temp; layoff, $180 for each worker laid off; inventory holding, $5 per unit-quarter; backorder, $10 per unit; straight time, $5 per hour; overtime, $8 per hour. Assume that the productivity is 0.5 unit per worker hour, with eight hours per day and 60 days per season. In each quarter, produce to the full output of your regular workforce, even if that results in excess production. In Winter and Spring, use overtime only if needed to meet the production required in that quarter. Do not use overtime to build excess inventory in prior seasons expressly for the purpose of reducing the number of temp workers in Summer. (Leave no cells blank - be certain to enter "O" wherever required. Negative values should be indicated by a minus sign. Round up "Number of temp workers, Workers hired and Workers laid off" to the next whole number and all other answers to the nearest whole number.) Forecast Beginning inventory Production required Production hours required Production hours available Overtime hours Temp workers Temp worker hours available Total hours available Actual production Ending inventory Workers hired Workers laid off Fall Winter Spring Summer 10,200 7,700 6,700 12,200 Fall Winter Spring Summer Straight time Overtime Inventory Backorder Hiring Layoff Total Annual cost Starbucks has a large, global supply chain that must efficiently supply over 17,000 stores. Although the stores might appear to be very similar, they are actually very different. Depending on the location of the store, its size, and the profile of the customers served, Starbucks management configures the store offerings to take maximum advantage of the space available and customer preferences. Starbucks' actual distribution system is much more complex, but for the purpose of our exercise let's focus on a single item that is currently distributed through five distribution centers in the United States. Our item is a logo-branded coffeemaker that is sold at some of the larger retail stores. The coffeemaker has been a steady seller over the years due to its reliability and rugged construction. Starbucks does not consider this a seasonal product, but there is some variability in demand. Demand for the product over the past 13 weeks is shown in the following table. (week -1 is the week before week 1 in the table, -2 is two weeks before week 1, etc.). Management would like you to experiment with some forecasting models to determine what should be used in a new system to be implemented. The new system is programmed to use one of two forecasting models: simple moving average or exponential smoothing. WEEK -5 -4 -3 Atlanta 48 34 33 Boston 55 25 45 Chicago 54 20 65 Dallas 40 35 35 LA 44 40 -2 -1 1 2 3 4 5 6 7 8 9 10 11 12 13 55 32 32 46 36 33 55 28 20 58 45 36 25 55 41 40 31 33 34 42 43 46 46 54 24 60 45 32 45 52 40 40 45 33 25 52 47 69 65 30 24 96 35 44 49 60 42 28 28 34 40 50 62 68 62 48 42 36 43 42 50 40 35 36 42 45 45 47 66 42 35 39 42 46 53 49 Total 241 154 228 235 180 174 183 182 213 245 271 249 209 216 261 174 240 233 a. Consider using a simple moving average model. Experiment with models using five weeks' and three weeks' past data. (Round your answers to 2 decimal places.) 3-week MA Week ATL BOS CHI DAL LA Total 1 2 3 4 5 6 7 8 9 10 11 12 13 5-week MA Week ATL BOS CHI DAL LA Total 1 2 3 4 5 6 7 8 9 10 11 12 13 b. Evaluate the forecasts that would have been made over the 13 weeks using the overall (at the end of the 13 weeks) mean absolute deviation, mean absolute percent error, and tracking signal as criteria. (Negative values should be indicated by a minus sign. Round all answers to 2 decimal places. Enter "MAPE" answers as a percentage rounded to 2 decimal places.) ATL BOS CHI DAL LA Avg of DCs 3-week MA MAD MAPE TS 5-week MA MAD MAPE TS Given the following history, use a three-quarter moving average to forecast the demand for the third quarter of this year. Note, the 1st quarter is Jan, Feb, and Mar; 2nd quarter Apr, May, Jun; 3rd quarter Jul, Aug, Sep; and 4th quarter Oct, Nov, Dec. JAN Last year 160 This year FEB 180 180 190 150 MAR APR MAY JUN JUL AUG SEP OCT NOV DEC 190 230 240 260 205 195 185 260 285 310 250 235 210 Forecast for the third quarter The following table contains the number of complaints received in a department store for the first 6 months of operation: MONTH COMPLAINTS January 40 February 51 March 87 April 102 May June 120 148 If a three-month moving average is used to smooth this series, what would have been the forecast for May? Forecast for May Demand for stereo headphones and MP3 players for joggers has caused Nina Industries to grow almost 50 percent over the past year. The number of joggers continues to expand, so Nina expects demand for headsets to also expand, because, as yet, no safety laws have been passed to prevent joggers from wearing them. Demand for the players for last year was as follows: MONTH DEMAND (UNITS) January February 4,115 4,215 March 3,915 April 4,315 May 4,915 June 4,615 July 5,215 August 4,815 September 5,315 October 5,615 November 6,215 December 5,915 a. Using linear regression analysis, what would you estimate demand to be for each month next year? (Do not round intermediate calculations. Round your answers to 2 decimal places.) Month Forecast January February March April May June July August September October November December b. To be reasonably confident of meeting demand, Nina decides to use 4 standard errors of estimate for safety. How many additional units should be held to meet this level of confidence? (Do not round intermediate calculations. Round your answer to the nearest whole number.) Additional units A particular forecasting model was used to forecast a six-month period. Here are the forecasts and actual demands that resulted: FORECAST ACTUAL April 260 210 May 334 258 June 409 325 July August September 359 310 384 336 459 412 a. Find the tracking signal for each month. (Negative values should be indicated by a minus sign. Round your answers to the nearest whole number.) Month Tracking Signal April May June July August September b. Does the model used here give acceptable answers? No, the model's performance is poor. Yes, the model's performance is good. The following are historical demand data: ACTUAL YEAR SEASON DEMAND 2011 Spring 204 Summer 146 Fall 372 Winter 574 2012 Spring 474 Summer 276 Fall 690 Winter 955 Use regression analysis on deseasonalized demand to forecast demand in summer 2013. (Do not round intermediate calculations. Round your answer to the nearest whole number.) Forecast for summer 2013
Step by Step Solution
There are 3 Steps involved in it
Step: 1
To solve the problem concerning the production plan well break it down into steps and calculate the costs for each quarter Step 1 Calculate Production ...
Get Instant Access to Expert-Tailored Solutions
See step-by-step solutions with expert insights and AI powered tools for academic success
Step: 2

Step: 3

Ace Your Homework with AI
Get the answers you need in no time with our AI-driven, step-by-step assistance
Get Started


