Question 1
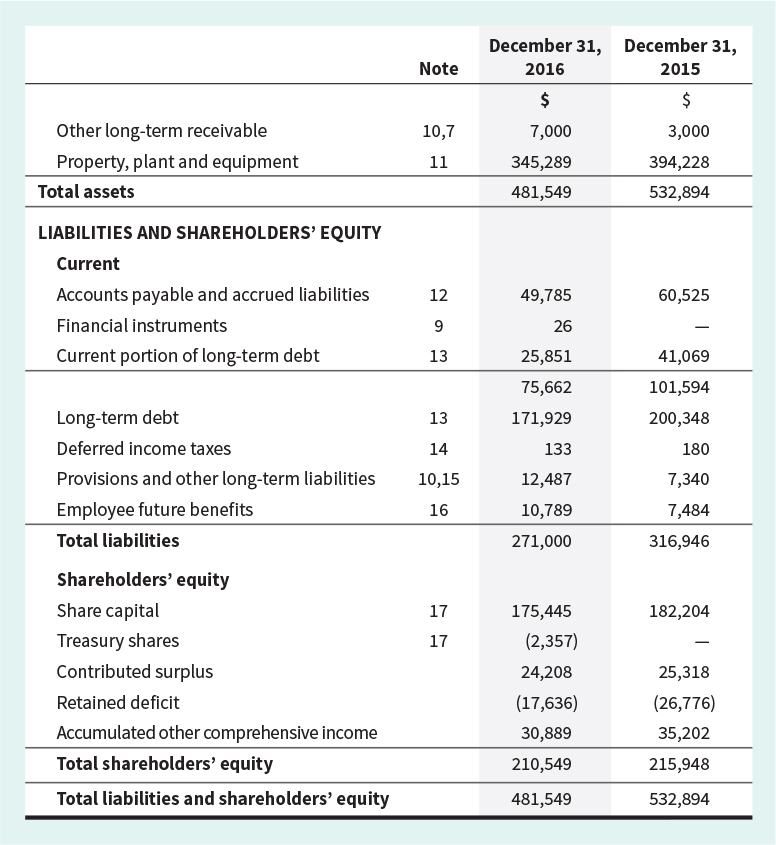
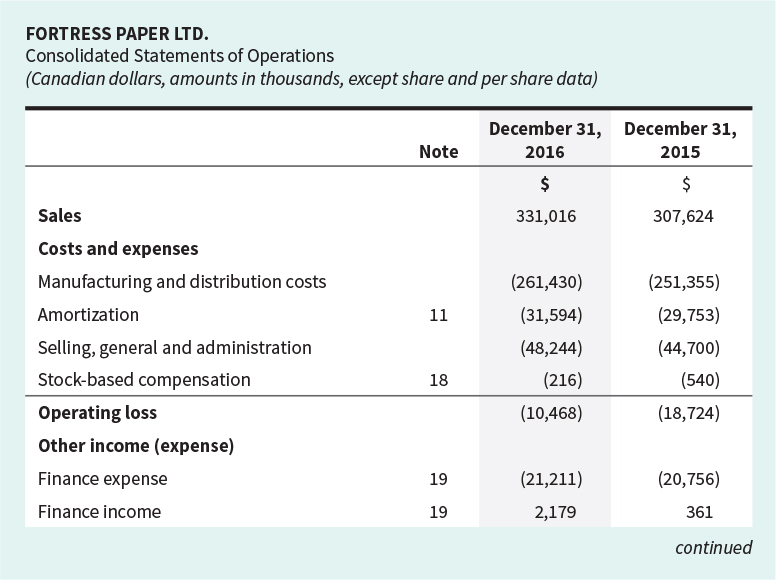
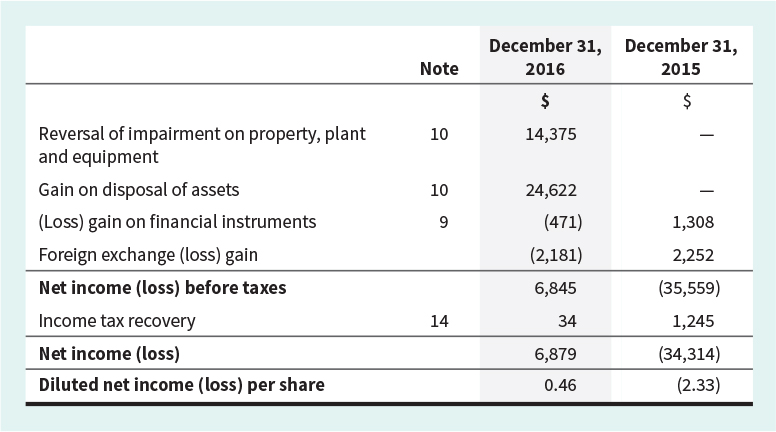
Fortress Paper Ltd. operates internationally in three distinct business segments: dissolving pulp, specialty papers, and security paper products. The consolidated statements of financial position and statement of income (statement of operations) from Fortresss 2016 annual report are presented in Exhibits 10.16A and 10.16B.
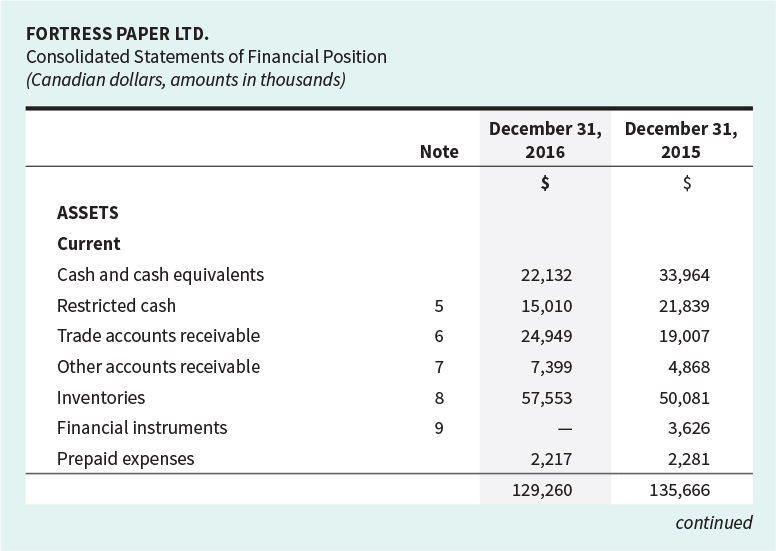
(a) Calculate the debt to equity ratio, the net debt as a percentage of total capitalization ratio, and the interest coverage ratio for 2016 and 2015. (Round interest coverage ratio to 1 decimal place, e.g. 15.7 and all other answers to 2 decimal places, e.g. 15.25. Enter negative amounts using either a negative sign preceding the number e.g. -45 or parentheses e.g. (45).)
| | 2016 | | 2015 |
Debt to Equity Ratio | | | | | | |
Net Debt as a Percentage of Total Capitalization | | | | | | |
Interest Coverage Ratio | | | times | | | times |
FORTRESS PAPER LTD. Consolidated Statements of Financial Position (Canadian dollars, amounts in thousands) Note December 31, December 31, 2016 2015 ASSETS Current Cash and cash equivalents Restricted cash Trade accounts receivable Other accounts receivable Inventories Financial instruments Prepaid expenses 22,132 15,010 24,949 7,399 57,553 33,964 21,839 19,007 4,868 50,081 3,626 2,281 135,666 continued 2,217 129,260 Note December 31, December 31, 2016 2015 10,7 Other long-term receivable Property, plant and equipment Total assets 11 7,000 345,289 481,549 3,000 394,228 532,894 LIABILITIES AND SHAREHOLDERS' EQUITY Current Accounts payable and accrued liabilities Financial instruments Current portion of long-term debt 12 60,525 13 41,069 13 49,785 26 25,851 75,662 171,929 133 12,487 10,789 271,000 Long-term debt Deferred income taxes Provisions and other long-term liabilities Employee future benefits Total liabilities 14 101,594 200,348 180 7,340 7,484 316,946 10,15 16 182,204 17 Shareholders' equity Share capital Treasury shares Contributed surplus Retained deficit Accumulated other comprehensive income Total shareholders' equity Total liabilities and shareholders' equity 175,445 (2,357) 24,208 (17,636) 30,889 210,549 481,549 25,318 (26,776) 35,202 215,948 532,894 FORTRESS PAPER LTD. Consolidated Statements of Operations (Canadian dollars, amounts in thousands, except share and per share data) December 31, December 31, 2016 2015 Note 331,016 307,624 Sales Costs and expenses Manufacturing and distribution costs Amortization Selling, general and administration Stock-based compensation Operating loss Other income (expense) (261,430) (31,594) (48,244) (216) (10,468) (251,355) (29,753) (44,700) (540) (18,724) Finance expense (20,756) (21,211) 2,179 Finance income 361 continued Note December 31, December 31, 2016 2015 14,375 1,308 Reversal of impairment on property, plant and equipment Gain on disposal of assets (Loss) gain on financial instruments Foreign exchange (loss) gain Net income (loss) before taxes Income tax recovery Net income (loss) Diluted net income (loss) per share 24,622 (471) (2,181) 6,845 2,252 (35,559) 1,245 34 6,879 0.46 (34,314) (2.33)