Question
1) need Calculate the Rate of return
2) need calculate Trade analysis
3) need Ratio analysis
Base on statement below;
PLEASE HELP ME TO ANSWER THIS QUESTION..PLEASE PLEASE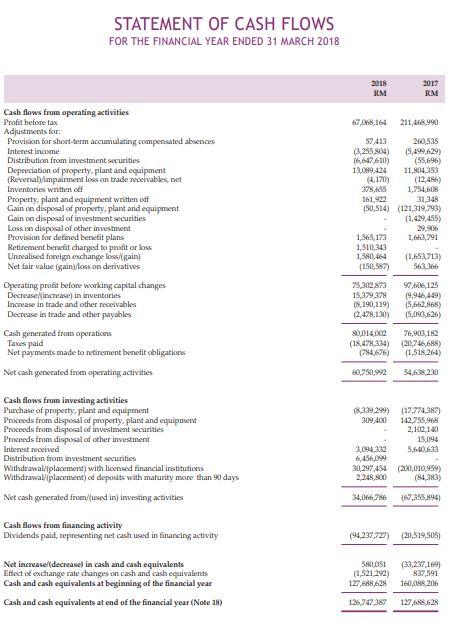
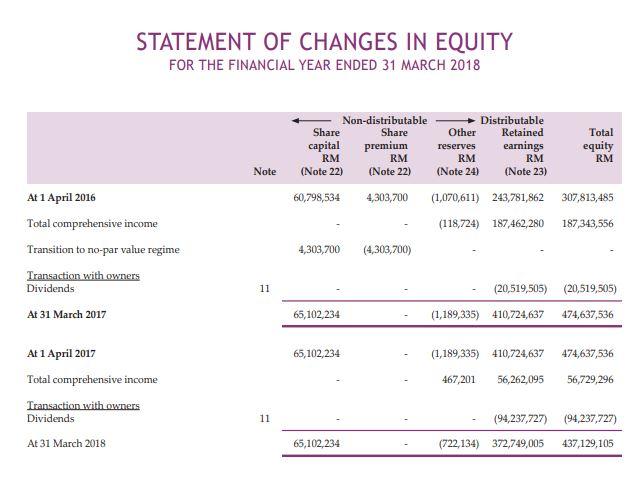
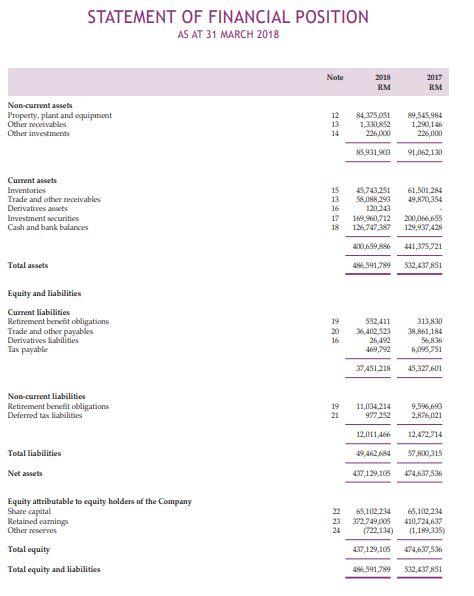
STATEMENT OF CHANGES IN EQUITY FOR THE FINANCIAL YEAR ENDED 31 MARCH 2018 Total equity RM Note Non-distributable Distributable Share Share Other Retained capital premium reserves earnings RM RM RM RM (Note 22) (Note 22) (Note 24) (Note 23) 60,798,534 4,303,700 (1,070,611) 243,781,862 (118,724) 187,462,280 4,303,700 (4,303,700) 307,813,485 187,343,556 At 1 April 2016 Total comprehensive income Transition to no-par value regime Transaction with owners Dividends At 31 March 2017 11 (20,519,505) (20,519,505) (1,189,335) 410,724,637 474,637,536 65,102,234 65,102,234 (1,189,335) 410,724,637 474,637,536 At 1 April 2017 Total comprehensive income Transaction with owners Dividends 467,201 56,262,095 56,729,296 11 (94,237,727) (94,237,727) (722,134) 372,749,005 437,129,105 At 31 March 2018 65,102,234 STATEMENT OF FINANCIAL POSITION AS AT 31 MARCH 2018 Note 2015 RM 2017 RM Non-current assets Property, plant and equipment Other receivables Other investments 12 13 14 84,375,051 1,330,852 226,000 89,545,984 1,290,146 226,000 85,931,909 91,062,130 Current assets Inventories Trade and other receivables Derivatives anses Investment securities Cash and bank balances 61,501,284 49,870,354 15 13 16 17 18 45743.251 58,188,293 120,243 169,90,712 126747387 200,066,655 129,937,428 400,659886 441,375,721 Total assets 496,591,789 532,437 851 Equity and liabilities Current liabilities Retirement benefit obligations Trade and other payables Derivatives habilities Tax payable 19 20 16 552,411 36,402.522 26.492 469,792 313,830 38,861,184 56,836 6,095,751 37,451,218 45,327.601 Non-current liabilities Retirement benefit obligations Deferred tax liabilities 19 21 11,034 214 977,252 9,596,690 2,876,021 12,011,466 12,472,714 Total liabilities 49,462,684 5.800,315 Net assets 437 129,105 174,637,536 Equity attributable to equity holders of the Company Share capital Retained earnings Other reserves . 22 63,102234 23 372,749,005 722,134) 437,129,105 68,102,234 410,724,637 (1,189,335) Total equity 474,637,536 Total equity and liabilities 496,591.789 532,437 851 STATEMENT OF CASH FLOWS FOR THE FINANCIAL YEAR ENDED 31 MARCH 2018 2018 RM 2013 RM 67,068,164 211,468,990 Cash flows from operating activities Profit before tax Adjustments for Provision for short-term accumulating compensated absences Interest income Distribution from investment securities Depreciation of property, plant and equipment (Reversal impairment loss on trade receivables.net Inventoriss written off Property, plant and equipment written off Gain on disposal of property, plant and equipment Gain on disposal of investment securities Loss on disposal of other investment Provision for defined benefit plans Retirement benefit charged to profit or loss Unrealised foreign exchange loss/gain) Net fair value gainisson derivatives Operating profit before working capital changes Decrease increase in inventories Increase in trade and other receivables Decrease in trade and other payables Cash generated from operations Taxes paid Net payments made to retirement benefit obligaties Net cash generated from operating activities 57,413 260,535 (3.255.804 5,499,629) 16.647,610) (55,696) 13,089,424 11,804,353 (4.170) (12,486) 378.55 1,754,608 161,922 31,348 (50,514) (121,319,793) (1,429,455) 29,906 1,565,173 1,663,791 1,510,343 1.580,464 (1,653,713) (150,587) 563,366 75,302.873 97,606,125 15,379,378 19,946,449) (8,190,119) 5,662,868) 2,478,130) 15,093,626) 80,014,000 76,903,182 (18,478,334) (20,746,688) (784,676) (1,518,264) 60,50,992 34,628,230 Cash flows from investing activities Purchase of property, plant and equipment Proceeds from disposal of property, plant and equipment Proceeds from disposal of investment securities Proceeds from dispoul of other investment Interest received Distribution from investment securities Withdrawalplacement) with licensed financial institutions Withdrawal (placement of deposits with maturity more than 90 days (8.339.299) (17,774,387) 309,400 142,753,968 2,100,140 15.094 3,194,332 5,5403 6,456,099 30,297 454 (200,010,959) 2.248.800 (84,383) Net cash generated from/used in investing activities 34,166.786 (67,355,894) Cash flows from financing activity Dividends paid, representing net cash used in financing activity (94.237.727) (20,519,505) Net increase/decrease in cash and cash equivalents Effect of exchange rate changes on cash and cash equivalents Cash and cash equivalents at beginning of the financial year Cash and cash equivalents at end of the financial year (Note 18) 590,051 (1,521,292) 127,688.628 (33,237,169) 837,591 160,088, 206 126,747,387 127,68.628 STATEMENT OF CHANGES IN EQUITY FOR THE FINANCIAL YEAR ENDED 31 MARCH 2018 Total equity RM Note Non-distributable Distributable Share Share Other Retained capital premium reserves earnings RM RM RM RM (Note 22) (Note 22) (Note 24) (Note 23) 60,798,534 4,303,700 (1,070,611) 243,781,862 (118,724) 187,462,280 4,303,700 (4,303,700) 307,813,485 187,343,556 At 1 April 2016 Total comprehensive income Transition to no-par value regime Transaction with owners Dividends At 31 March 2017 11 (20,519,505) (20,519,505) (1,189,335) 410,724,637 474,637,536 65,102,234 65,102,234 (1,189,335) 410,724,637 474,637,536 At 1 April 2017 Total comprehensive income Transaction with owners Dividends 467,201 56,262,095 56,729,296 11 (94,237,727) (94,237,727) (722,134) 372,749,005 437,129,105 At 31 March 2018 65,102,234 STATEMENT OF FINANCIAL POSITION AS AT 31 MARCH 2018 Note 2015 RM 2017 RM Non-current assets Property, plant and equipment Other receivables Other investments 12 13 14 84,375,051 1,330,852 226,000 89,545,984 1,290,146 226,000 85,931,909 91,062,130 Current assets Inventories Trade and other receivables Derivatives anses Investment securities Cash and bank balances 61,501,284 49,870,354 15 13 16 17 18 45743.251 58,188,293 120,243 169,90,712 126747387 200,066,655 129,937,428 400,659886 441,375,721 Total assets 496,591,789 532,437 851 Equity and liabilities Current liabilities Retirement benefit obligations Trade and other payables Derivatives habilities Tax payable 19 20 16 552,411 36,402.522 26.492 469,792 313,830 38,861,184 56,836 6,095,751 37,451,218 45,327.601 Non-current liabilities Retirement benefit obligations Deferred tax liabilities 19 21 11,034 214 977,252 9,596,690 2,876,021 12,011,466 12,472,714 Total liabilities 49,462,684 5.800,315 Net assets 437 129,105 174,637,536 Equity attributable to equity holders of the Company Share capital Retained earnings Other reserves . 22 63,102234 23 372,749,005 722,134) 437,129,105 68,102,234 410,724,637 (1,189,335) Total equity 474,637,536 Total equity and liabilities 496,591.789 532,437 851 STATEMENT OF CASH FLOWS FOR THE FINANCIAL YEAR ENDED 31 MARCH 2018 2018 RM 2013 RM 67,068,164 211,468,990 Cash flows from operating activities Profit before tax Adjustments for Provision for short-term accumulating compensated absences Interest income Distribution from investment securities Depreciation of property, plant and equipment (Reversal impairment loss on trade receivables.net Inventoriss written off Property, plant and equipment written off Gain on disposal of property, plant and equipment Gain on disposal of investment securities Loss on disposal of other investment Provision for defined benefit plans Retirement benefit charged to profit or loss Unrealised foreign exchange loss/gain) Net fair value gainisson derivatives Operating profit before working capital changes Decrease increase in inventories Increase in trade and other receivables Decrease in trade and other payables Cash generated from operations Taxes paid Net payments made to retirement benefit obligaties Net cash generated from operating activities 57,413 260,535 (3.255.804 5,499,629) 16.647,610) (55,696) 13,089,424 11,804,353 (4.170) (12,486) 378.55 1,754,608 161,922 31,348 (50,514) (121,319,793) (1,429,455) 29,906 1,565,173 1,663,791 1,510,343 1.580,464 (1,653,713) (150,587) 563,366 75,302.873 97,606,125 15,379,378 19,946,449) (8,190,119) 5,662,868) 2,478,130) 15,093,626) 80,014,000 76,903,182 (18,478,334) (20,746,688) (784,676) (1,518,264) 60,50,992 34,628,230 Cash flows from investing activities Purchase of property, plant and equipment Proceeds from disposal of property, plant and equipment Proceeds from disposal of investment securities Proceeds from dispoul of other investment Interest received Distribution from investment securities Withdrawalplacement) with licensed financial institutions Withdrawal (placement of deposits with maturity more than 90 days (8.339.299) (17,774,387) 309,400 142,753,968 2,100,140 15.094 3,194,332 5,5403 6,456,099 30,297 454 (200,010,959) 2.248.800 (84,383) Net cash generated from/used in investing activities 34,166.786 (67,355,894) Cash flows from financing activity Dividends paid, representing net cash used in financing activity (94.237.727) (20,519,505) Net increase/decrease in cash and cash equivalents Effect of exchange rate changes on cash and cash equivalents Cash and cash equivalents at beginning of the financial year Cash and cash equivalents at end of the financial year (Note 18) 590,051 (1,521,292) 127,688.628 (33,237,169) 837,591 160,088, 206 126,747,387 127,68.628