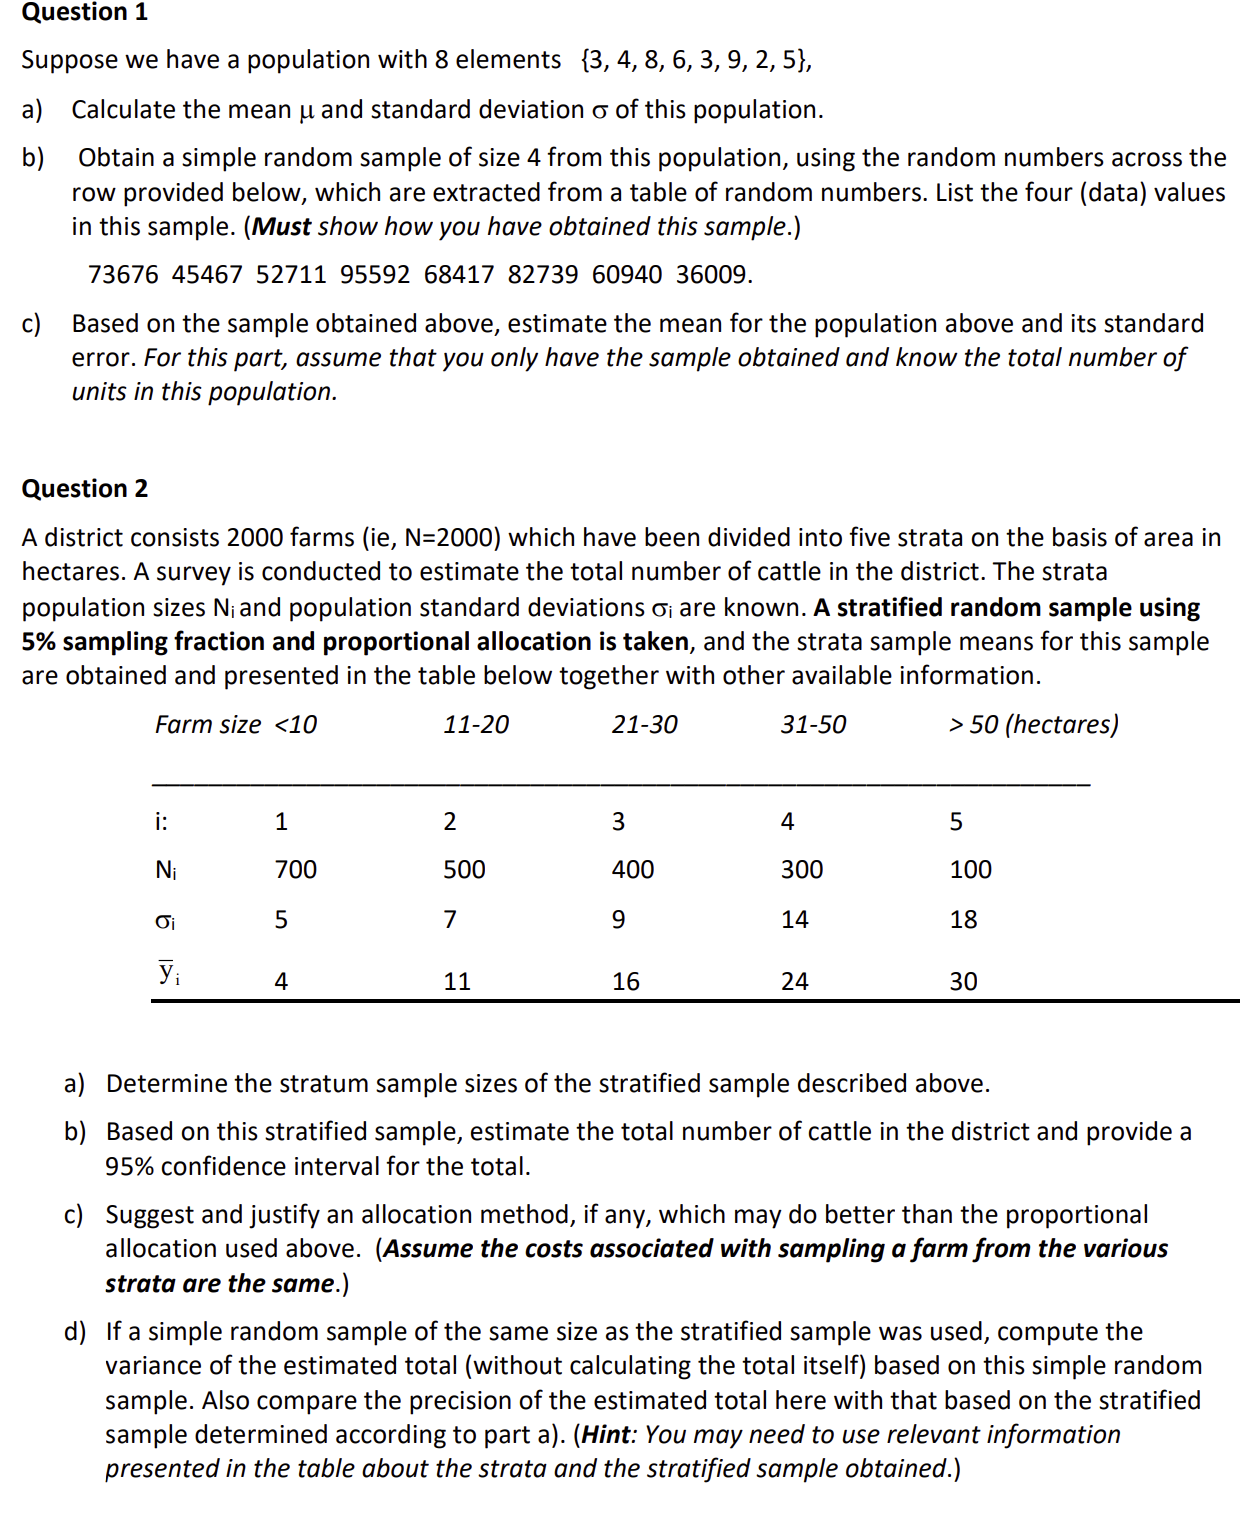
Question 1 Suppose we have a population with 8 elements {3, 4, 8, 6, 3, 9, 2, 5}, a) Calculate the mean u and standard deviation 0' of this population. b) Obtain a simple random sample of size 4 from this population, using the random numbers across the row provided below, which are extracted from a table of random numbers. List the four (data) values in this sample. (Must show how you have obtained this sample.) 73676 45467 52711 95592 68417 82739 60940 36009. c) Based on the sample obtained above, estimate the mean for the population above and its standard error. For this part, assume that you only have the sample obtained and know the total number of units in this population. Question 2 A district consists 2000 farms (ie, N=2000) which have been divided into five strata on the basis of area in hectares. A survey is conducted to estimate the total number of cattle in the district. The strata population sizes Niand population standard deviations O'i are known. A stratified random sample using 5% sampling fraction and proportional allocation is taken, and the strata sample means for this sample are obtained and presented in the table below together with other available information. Farm size 50 (hectares) | 1 2 3 4 5 Ni 700 500 400 300 100 0'. 5 7 9 14 18 i 4 11 1s 24 30 a) Determine the stratum sample sizes of the stratified sample described above. b) Based on this stratified sample, estimate the total number of cattle in the district and provide a 95% confidence interval for the total. c) Suggest and justify an allocation method, if any, which may do better than the proportional allocation used above. (Assume the costs associated with sampling a farm from the various strata are the same.) d) If a simple random sample of the same size as the stratified sample was used, compute the variance of the estimated total (without calculating the total itself) based on this simple random sample. Also compare the precision of the estimated total here with that based on the stratified sample determined according to part a). (Hint: You may need to use relevant information presented in the table about the strata and the stratified sample obtained.)


