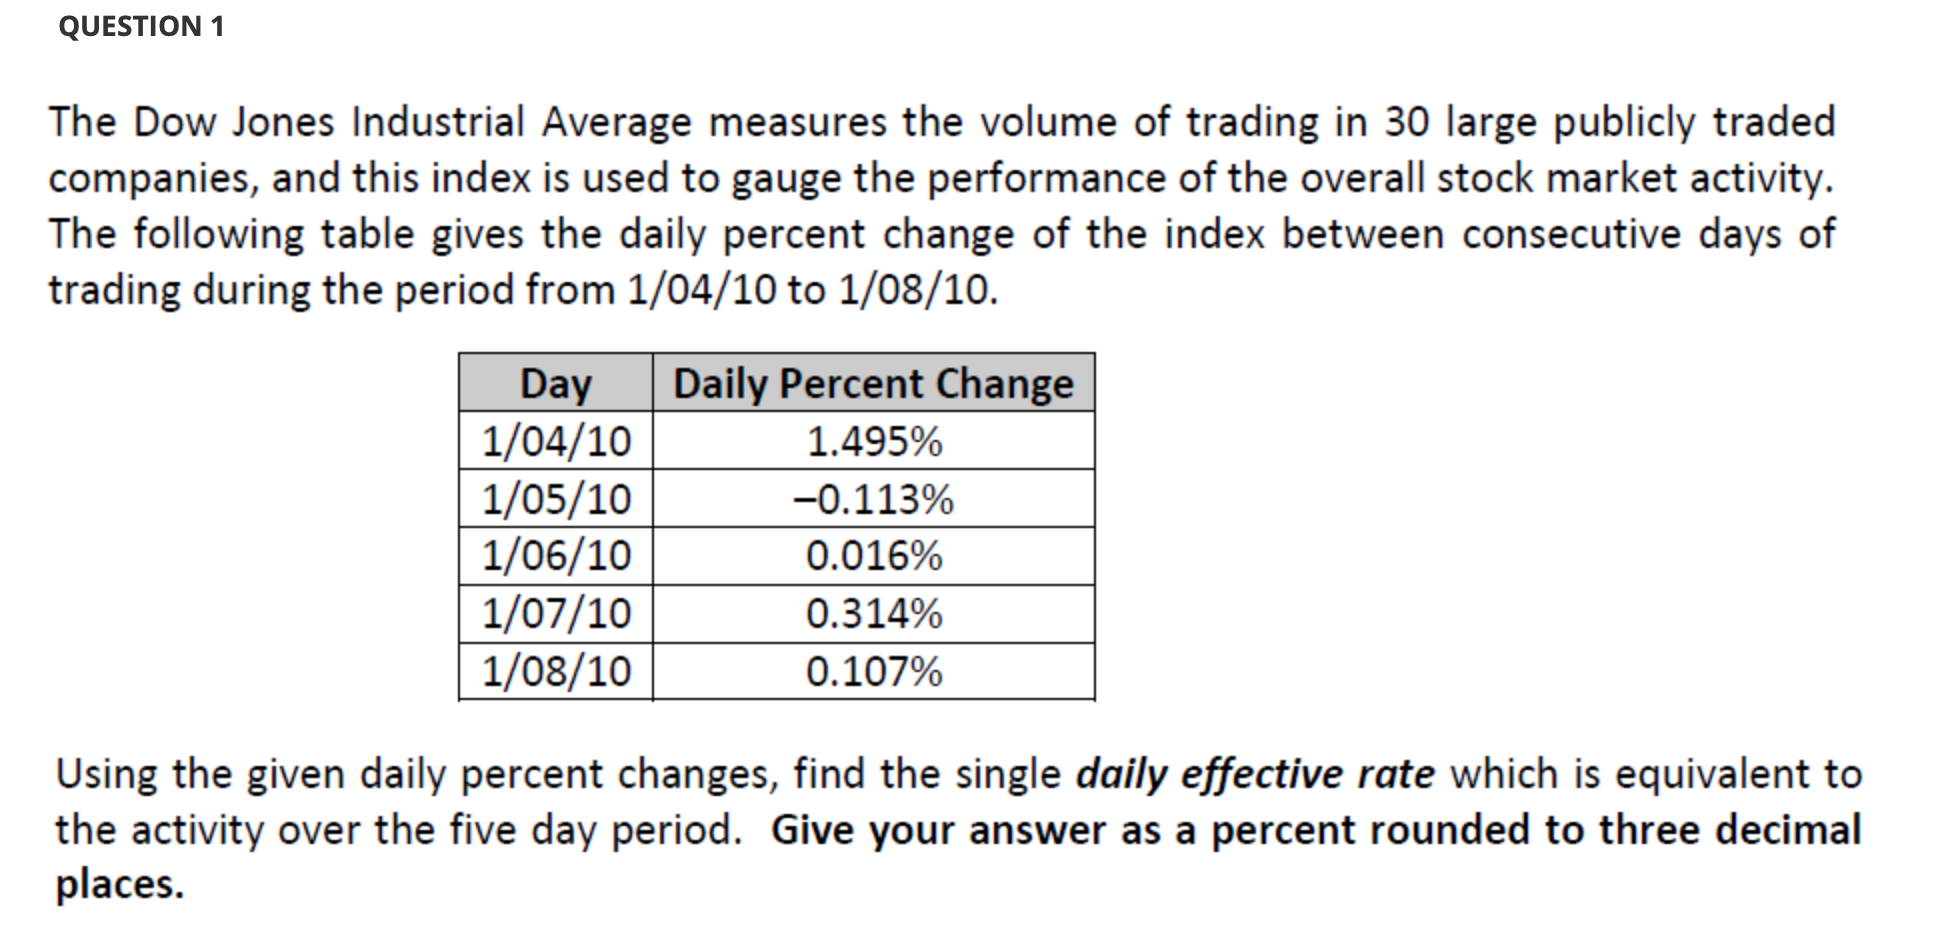

QUESTION 1 The Dow Jones Industrial Average measures the volume of trading in 30 large publicly traded companies, and this index is used to gauge the performance of the overall stock market activity. The following table gives the daily percent change of the index between consecutive days of trading during the period from 1/04/10 to 1/08/10. Day 1/04/10 1/05/10 1/06/10 1/07/10 1/08/10 Daily Percent Change 1.495% -0.113% 0.016% 0.314% 0.107% Using the given daily percent changes, find the single daily effective rate which is equivalent to the activity over the five day period. Give your answer as a percent rounded to three decimal places. 1. The Dow Jones Industrial Average measures the volume of trading in 30 large publicly traded companies, and this index is used to gauge the performance of the overall stock market activity. The following table gives the daily percent change of the index between consecutive days of trading during the period from 1/04/10 to 1/08/10. Day 1/04/10 1/05/10 1/06/10 1/07/10 1/08/10 Daily Percent Change 1.495% -0.113% 0.016% 0.314% 0.107% QUESTION 1 The Dow Jones Industrial Average measures the volume of trading in 30 large publicly traded companies, and this index is used to gauge the performance of the overall stock market activity. The following table gives the daily percent change of the index between consecutive days of trading during the period from 1/04/10 to 1/08/10. Day 1/04/10 1/05/10 1/06/10 1/07/10 1/08/10 Daily Percent Change 1.495% -0.113% 0.016% 0.314% 0.107% Using the given daily percent changes, find the single daily effective rate which is equivalent to the activity over the five day period. Give your answer as a percent rounded to three decimal places. 1. The Dow Jones Industrial Average measures the volume of trading in 30 large publicly traded companies, and this index is used to gauge the performance of the overall stock market activity. The following table gives the daily percent change of the index between consecutive days of trading during the period from 1/04/10 to 1/08/10. Day 1/04/10 1/05/10 1/06/10 1/07/10 1/08/10 Daily Percent Change 1.495% -0.113% 0.016% 0.314% 0.107%


