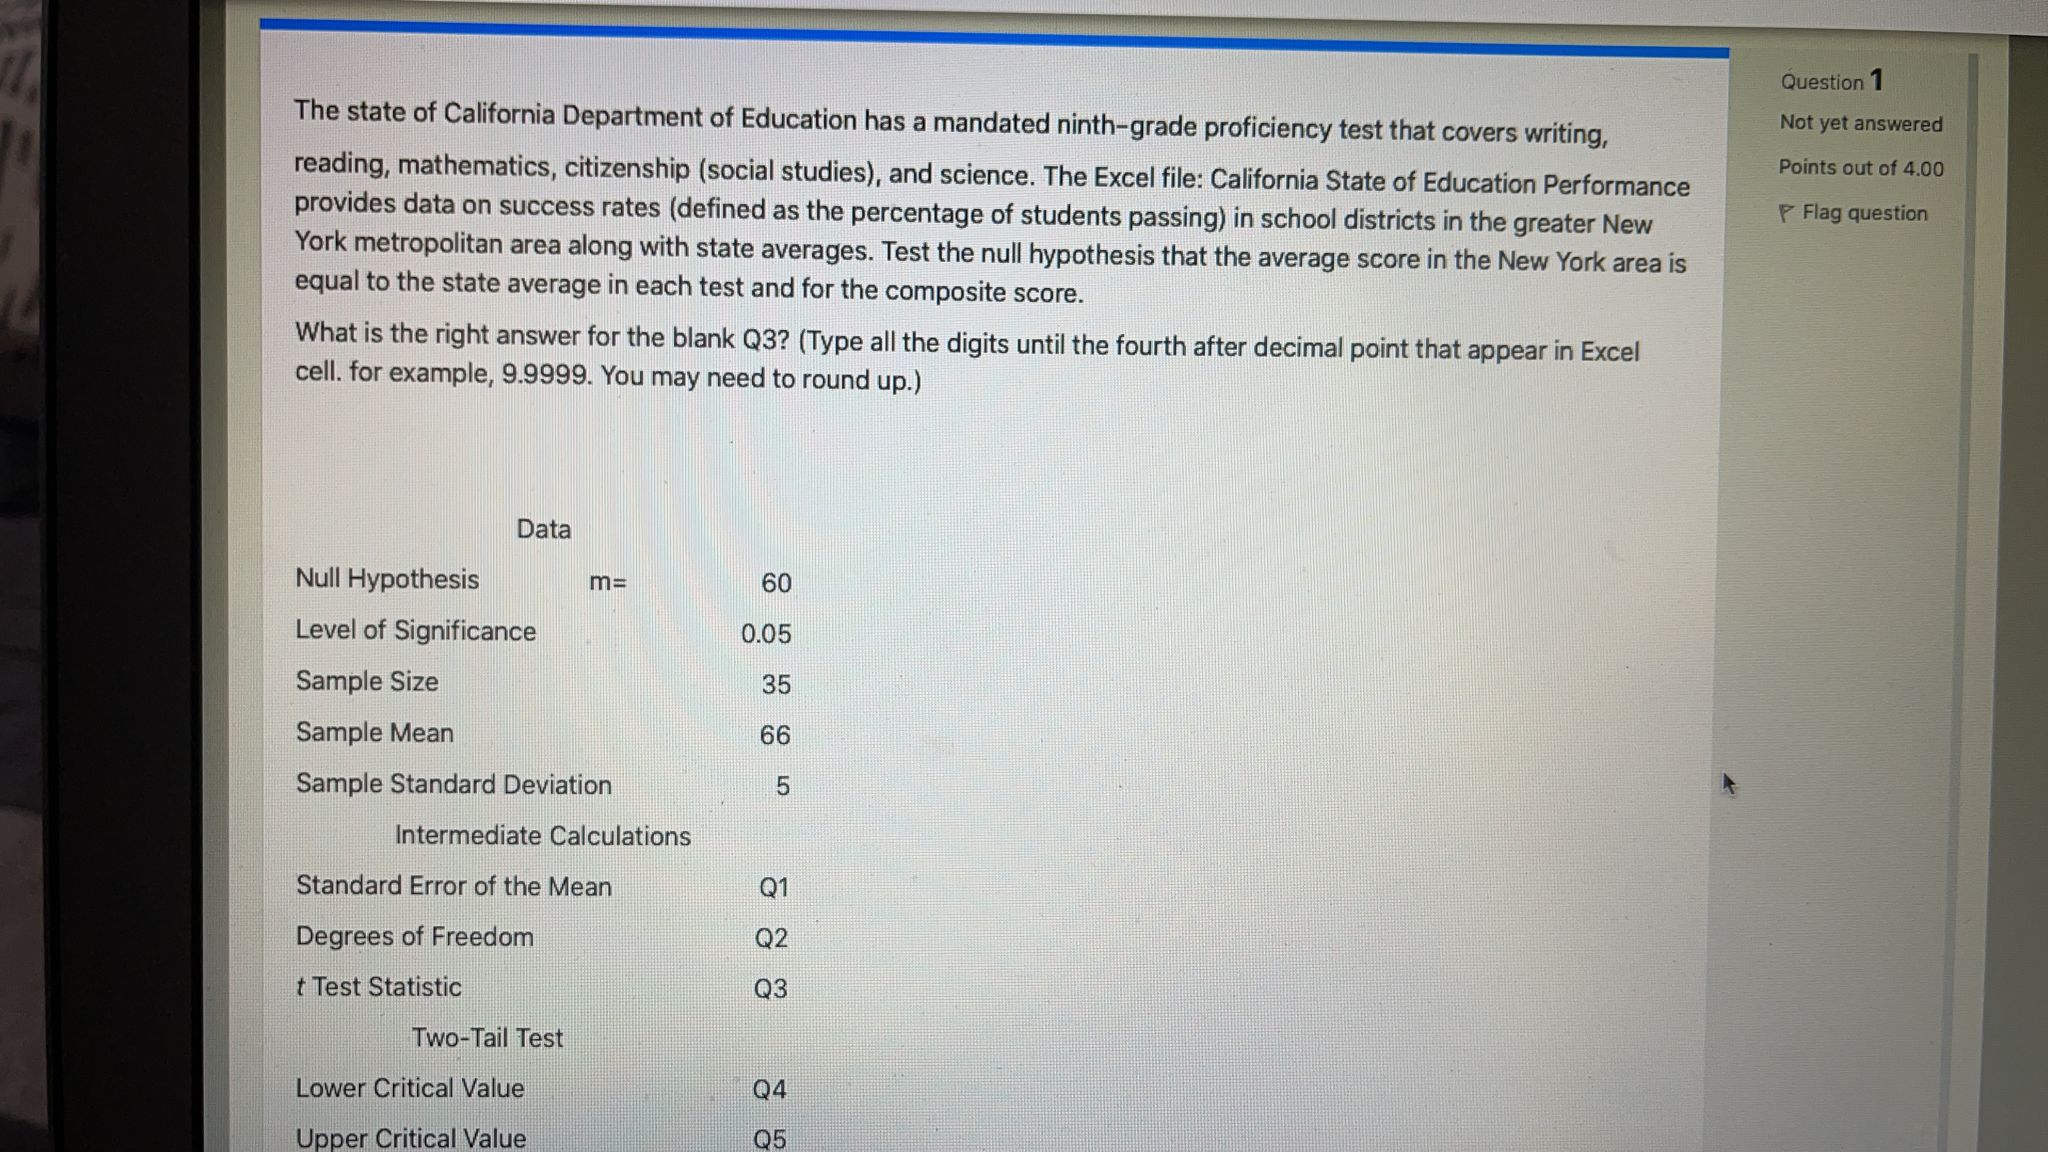
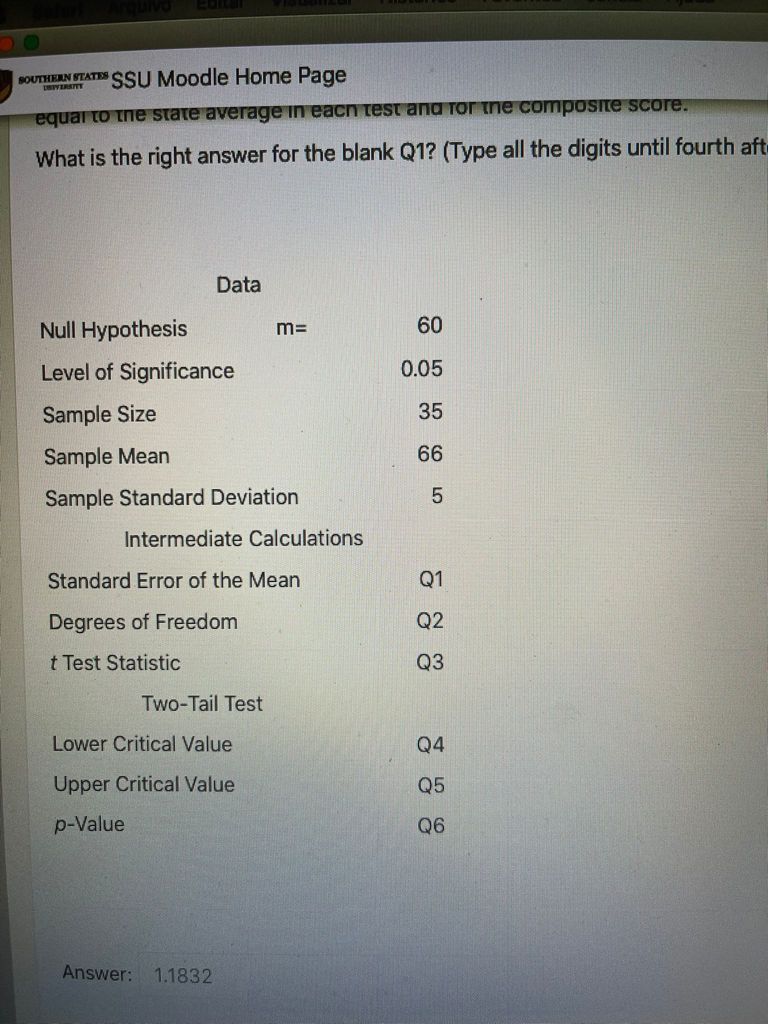
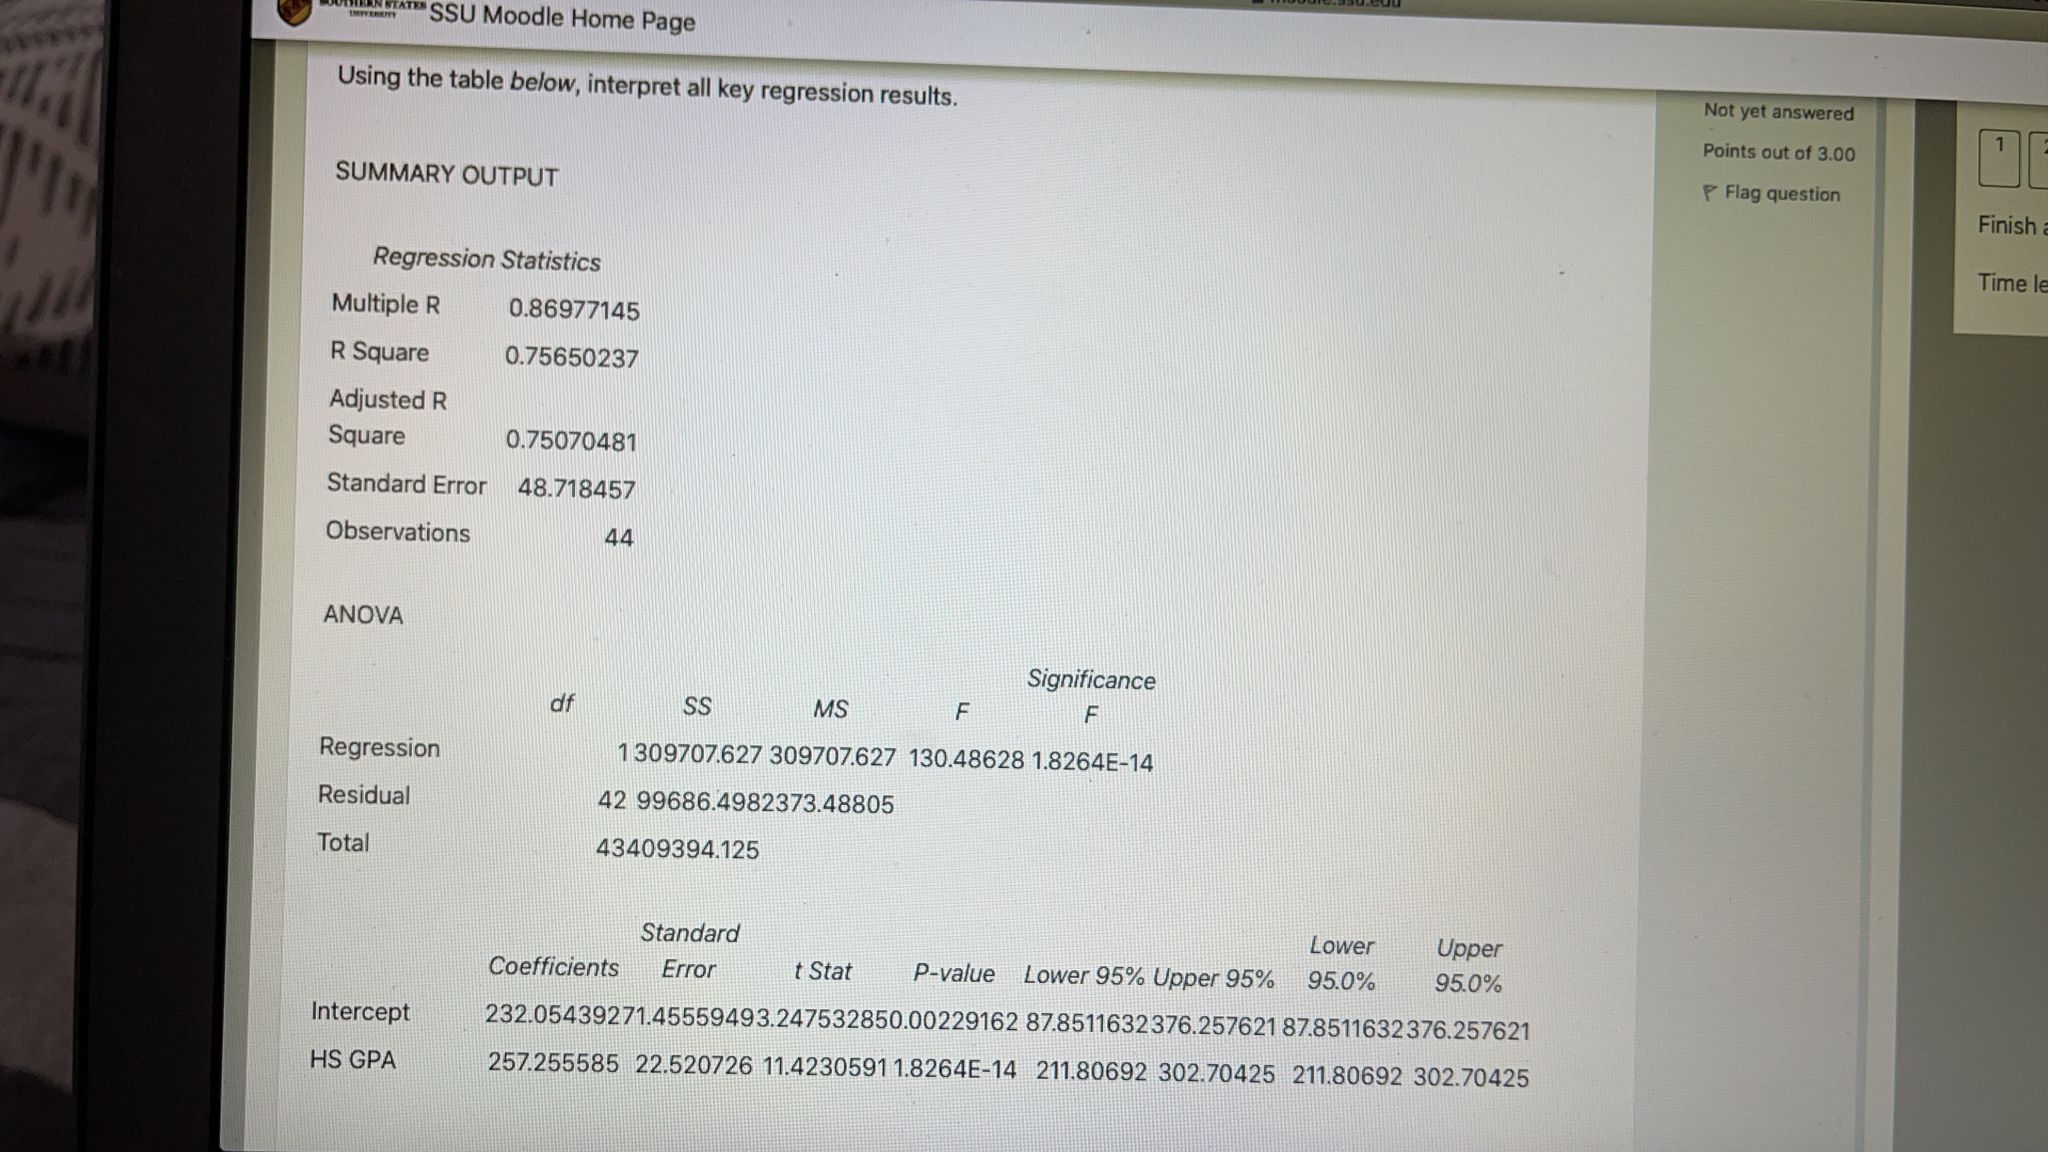
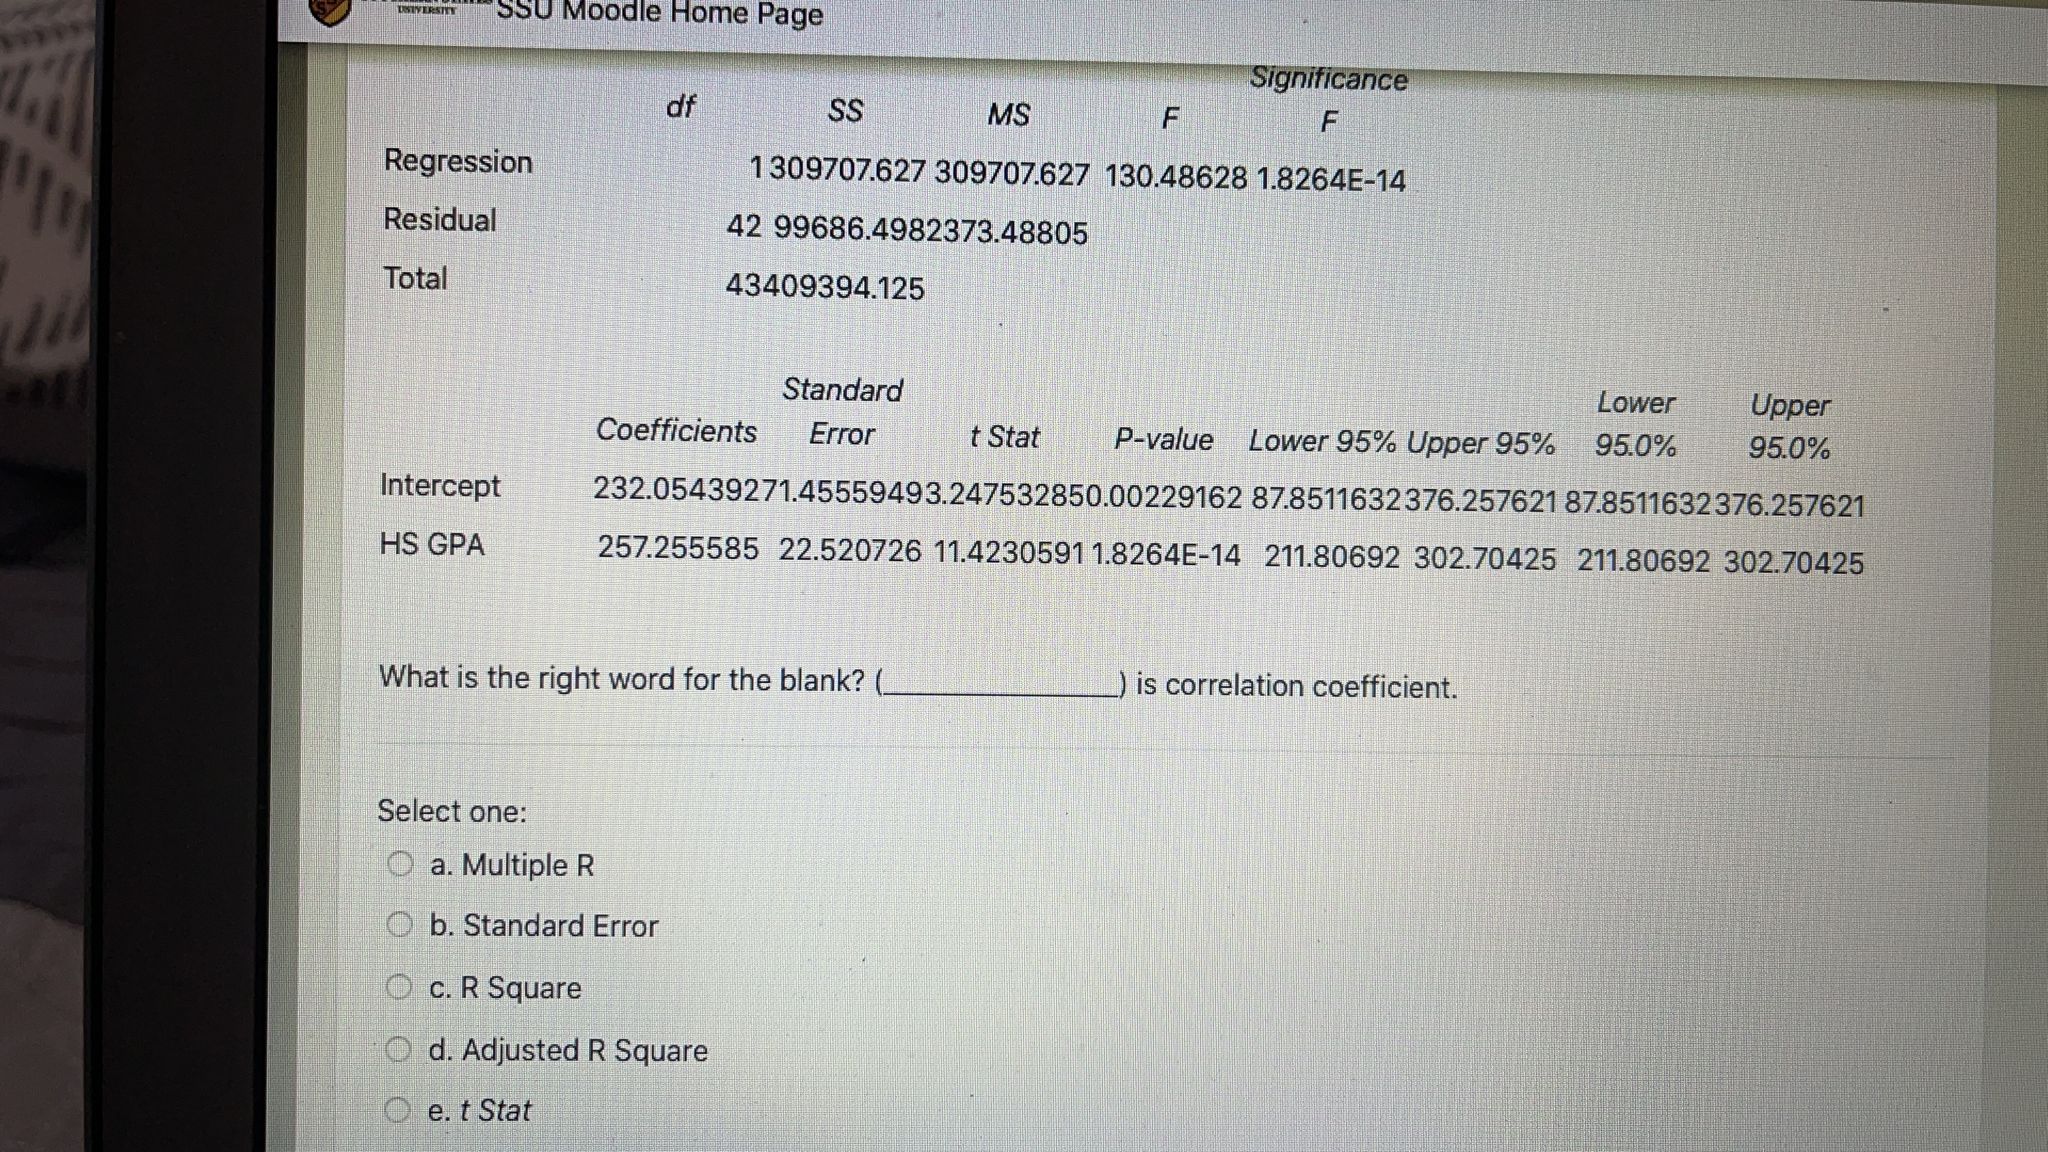
Question 1 The state of California Department of Education has a mandated ninth-grade proficiency test that covers writing, Not yet answered Points out of 4.00 reading, mathematics, citizenship (social studies), and science. The Excel file: California State of Education Performance provides data on success rates (defined as the percentage of students passing) in school districts in the greater New Flag question York metropolitan area along with state averages. Test the null hypothesis that the average score in the New York area is equal to the state average in each test and for the composite score. What is the right answer for the blank Q3? (Type all the digits until the fourth after decimal point that appear in Excel cell. for example, 9.9999. You may need to round up.) Data Null Hypothesis m= 60 Level of Significance 0.05 Sample Size 35 Sample Mean 66 Sample Standard Deviation 5 Intermediate Calculations Standard Error of the Mean Q1 Degrees of Freedom Q2 t Test Statistic Q3 Two-Tail Test Lower Critical Value Q4 Upper Critical Value Q5SOUTHERNSTATES SSU Moodle Home Page equal to the state average in each test and for the composite score. What is the right answer for the blank Q1? (Type all the digits until fourth aft Data Null Hypothesis m= 60 Level of Significance 0.05 Sample Size 35 Sample Mean 66 Sample Standard Deviation 5 Intermediate Calculations Standard Error of the Mean Q1 Degrees of Freedom Q2 t Test Statistic Q3 Two-Tail Test Lower Critical Value Q4 Upper Critical Value Q5 p-Value Q6 Answer: 1.1832"SSU Moodle Home Page Using the table below, interpret all key regression results. Not yet answered Points out of 3.00 SUMMARY OUTPUT Flag question Finish Regression Statistics Time le Multiple R 0.86977145 R Square 0.75650237 Adjusted R Square 0.75070481 Standard Error 48.718457 Observations 44 ANOVA Significance df SS MS F F Regression 1 309707.627 309707.627 130.48628 1.8264E-14 Residual 42 99686.4982373.48805 Total 43409394.125 Standard Lower Upper Coefficients Error t Stat P-value Lower 95% Upper 95% 95.0% 95.0% Intercept 232.05439271.45559493.247532850.00229162 87.8511632376.257621 87.8511632376.257621 HS GPA 257.255585 22.520726 11.4230591 1.8264E-14 211.80692 302.70425 211.80692 302.70425SSU Moodle Home Page Significance of SS MS F F Regression 1 309707.627 309707.627 130.48628 1.8264E-14 Residual 42 99686.4982373.48805 Total 43409394.125 Standard Lower Upper Coefficients Error t Stat P-value Lower 95% Upper 95% 95.0% 95.0% Intercept 232.05439271.45559493.247532850.00229162 87.8511632376.257621 87.8511632376.257621 HS GPA 257.255585 22.520726 11.4230591 1.8264E-14 211.80692 302.70425 211.80692 302.70425 What is the right word for the blank? ( )is correlation coefficient. Select one: O a. Multiple R O b. Standard Error O c. R Square O d. Adjusted R Square O e. t Stat