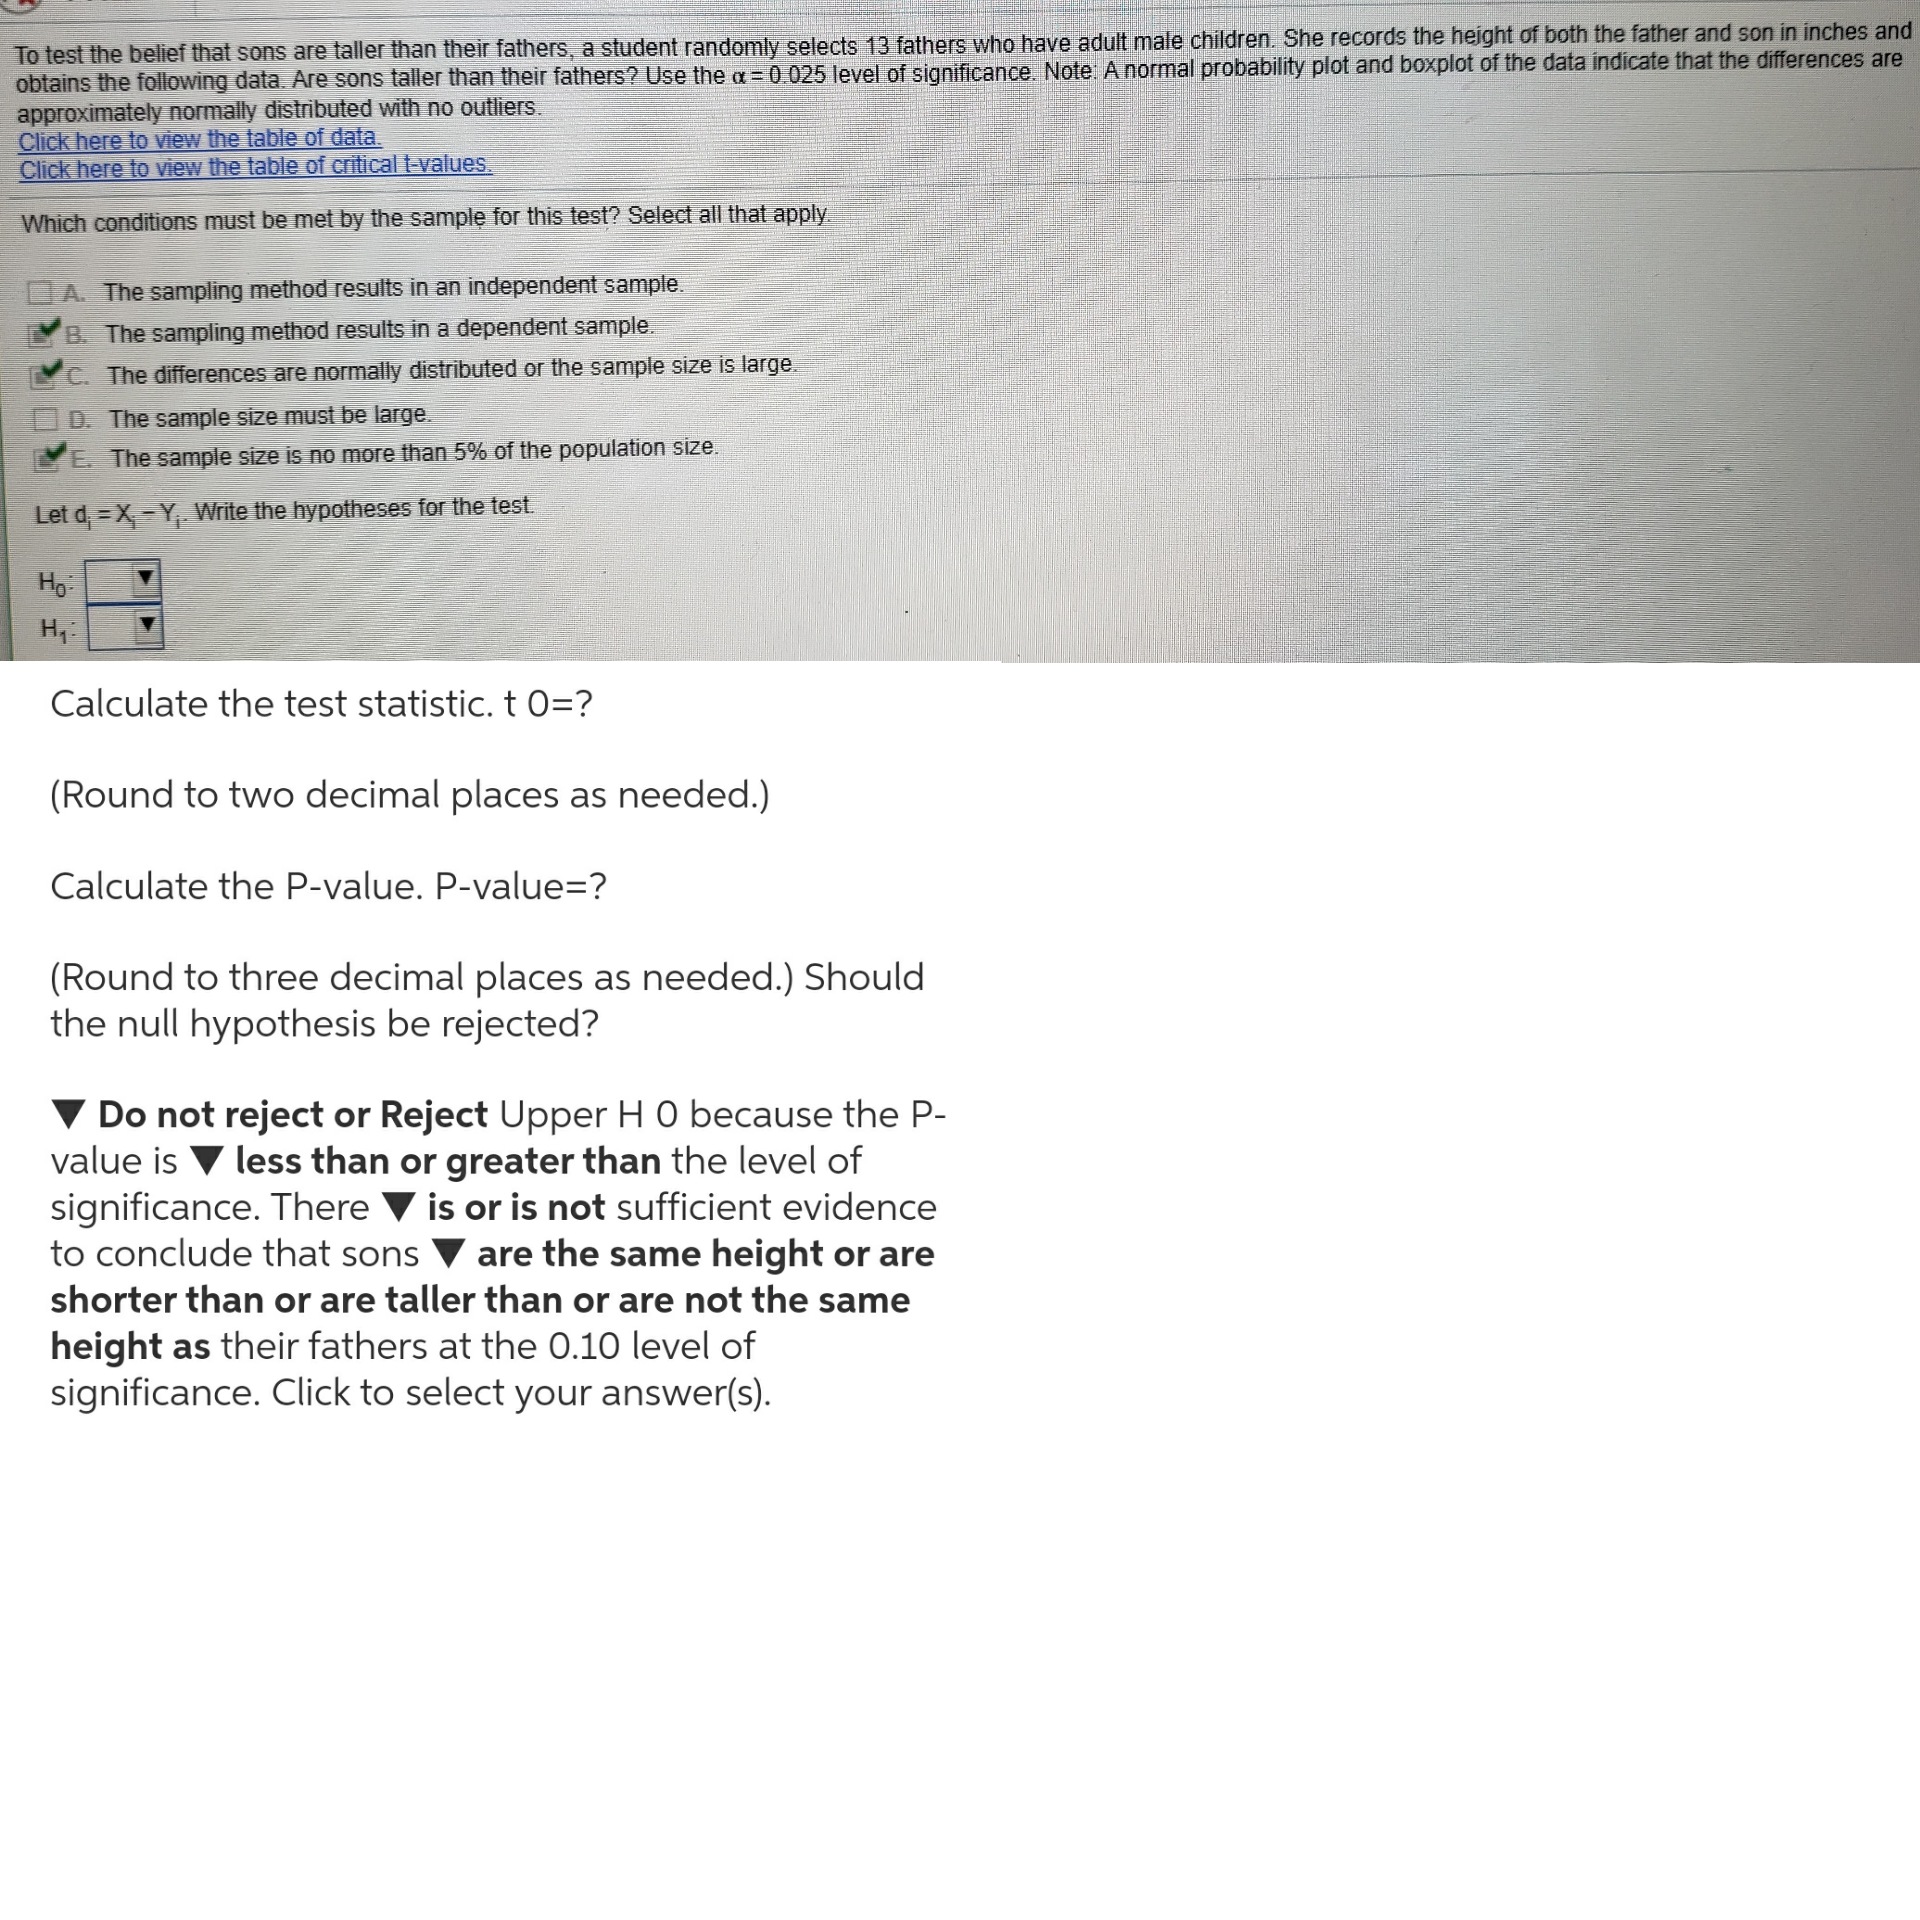
Question 1: to test the belief that sons are taller than their fathers, a student randomly selects 13 fathers who have adult male children...
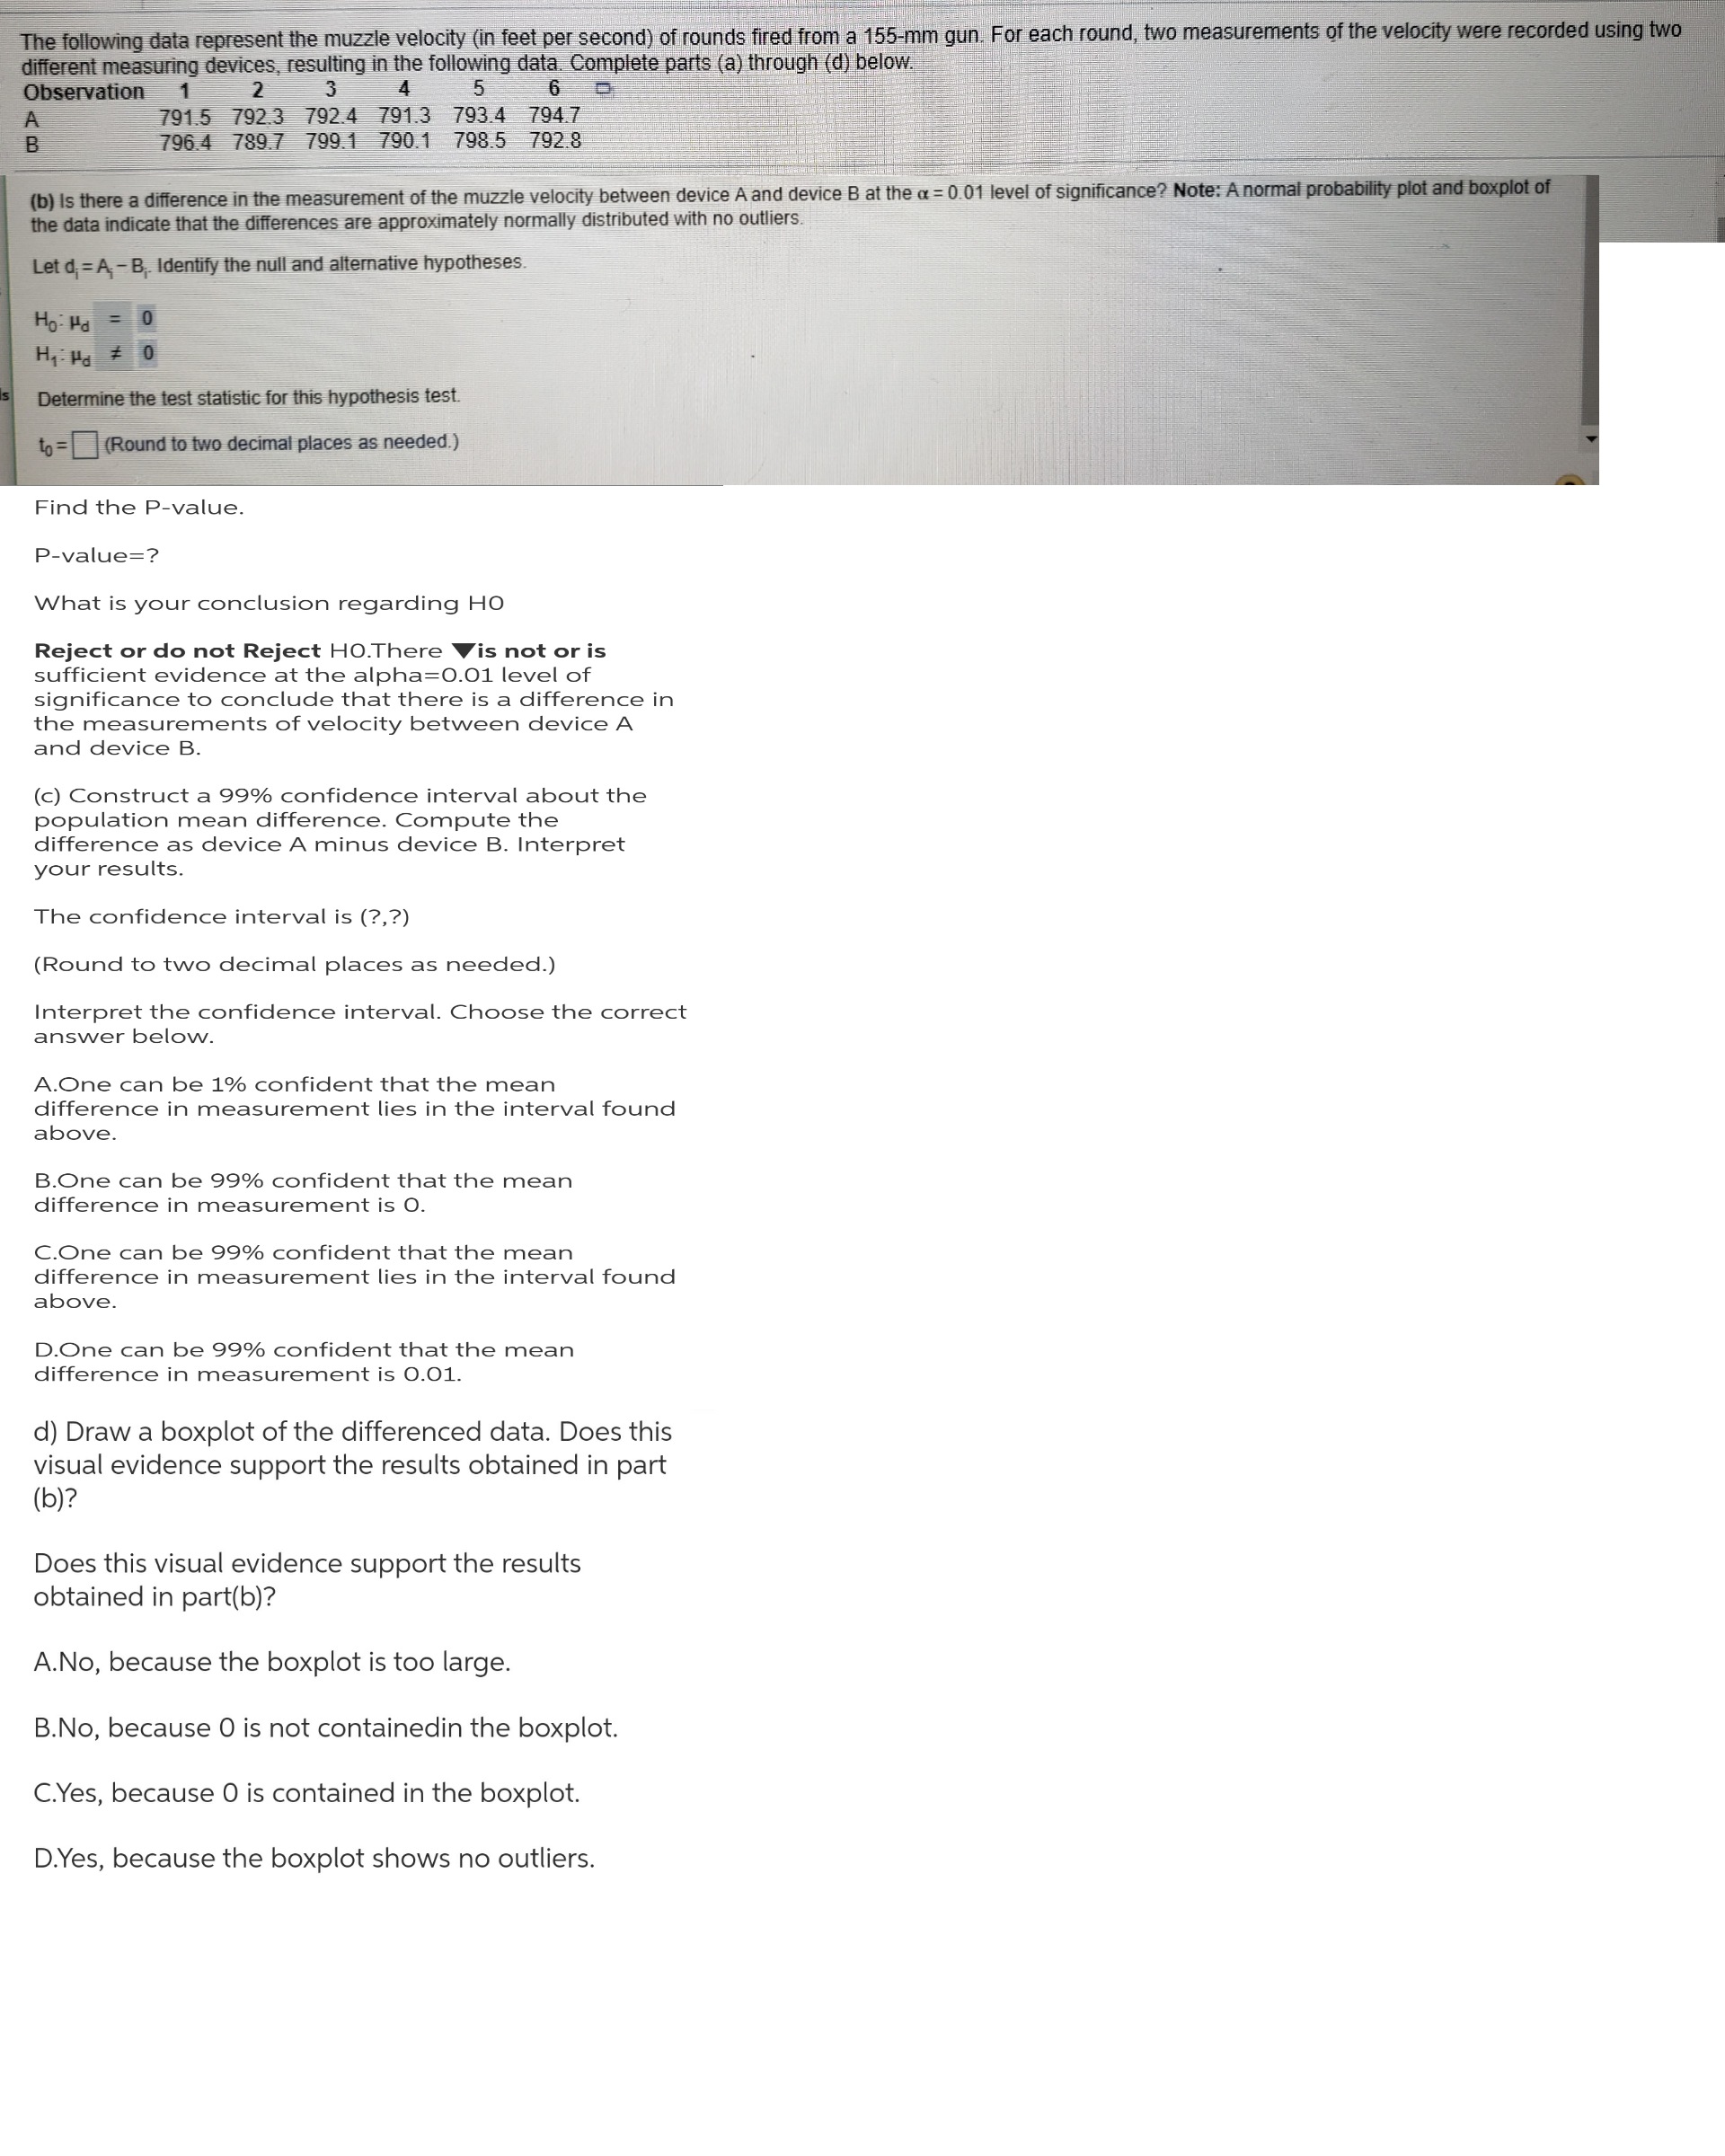
Question 2 : The following data represents the muzzle velocity...
The following data represent the muzzle velocity (in feet per second) of rounds fired from a 155-mm gun. For each round, two measurements of the velocity were recorded using two different measuring devices, resulting in the following data. Complete parts (a) through (d) below. Observation 1 2 3 4 5 6 2 791.5 792.3 792.4 791.3 793.4 794.7 796.4 789.7 799.1 790.1 798.5 792.8 (b) Is there a difference in the measurement of the muzzle velocity between device A and device B at the a = 0.01 level of significance? Note: A normal probability plot and boxplot of the data indicate that the differences are approximately normally distributed with no outliers. Let d, = A - Bj. Identify the null and alternative hypotheses. Ho- Hd Determine the test statistic for this hypothesis test. to =(Round to two decimal places as needed.) Find the P-value. P-value=? What is your conclusion regarding HO Reject or do not Reject HO.There Vis not or is sufficient evidence at the alpha=0.01 level of significance to conclude that there is a difference in the measurements of velocity between device A and device B. (c) Construct a 99% confidence interval about the population mean difference. Compute the difference as device A minus device B. Interpret your results. The confidence interval is (?,?) (Round to two decimal places as needed.) Interpret the confidence interval. Choose the correct answer below. A.One can be 1% confident that the mean difference in measurement lies in the interval found above. B.One can be 99% confident that the mean difference in measurement is O. C.One can be 99% confident that the mean difference in measurement lies in the interval found above D.One can be 99% confident that the mean difference in measurement is 0.01. d) Draw a boxplot of the differenced data. Does this visual evidence support the results obtained in part (b)? Does this visual evidence support the results obtained in part(b)? A.No, because the boxplot is too large. B.No, because 0 is not containedin the boxplot. C.Yes, because 0 is contained in the boxplot. D.Yes, because the boxplot shows no outliers.To test the belief that sons are taller than their fathers, a student randomly selects 13 fathers who have adult male children. She records the height of both the father and son in inches and obtains the following data. Are sons taller than their fathers? Use the a = 0.025 level of significance. Note: A normal probability plot and boxplot of the data indicate that the differences are approximately normally distributed with no outliers. Click here to view the table of data. Click here to view the table of critical I-values. Which conditions must be met by the sample for this test? Select all that apply. A. The sampling method results in an independent sample. B. The sampling method results in a dependent sample. YC. The differences are normally distributed or the sample size is large. D. The sample size must be large. E. The sample size is no more than 5% of the population size. Let d, = X, - Y,. Write the hypotheses for the test. Ho- Hy : Calculate the test statistic. t 0=? 'Round to two decimal places as needed.) Calculate the P-value. P-value=? (Round to three decimal places as needed.) Should the null hypothesis be rejected? Do not reject or Reject Upper H 0 because the P- value is V less than or greater than the level of significance. There V is or is not sufficient evidence to conclude that sons V are the same height or are shorter than or are taller than or are not the same height as their fathers at the 0.10 level of significance. Click to select your answer(s)


