QUESTION 1:
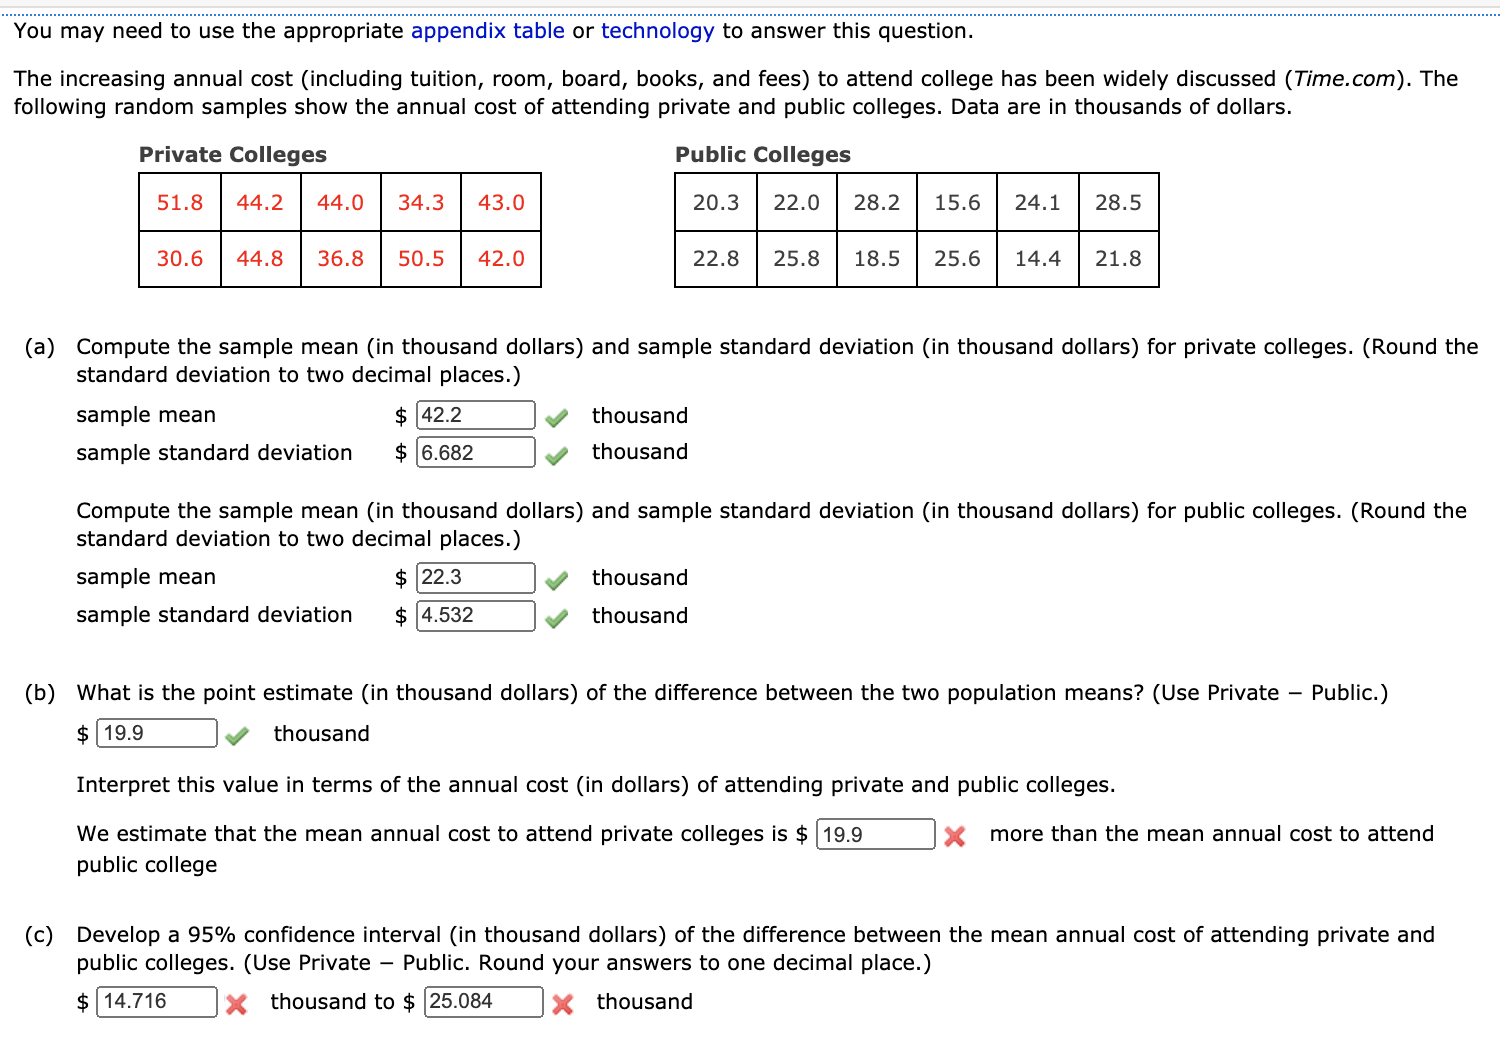
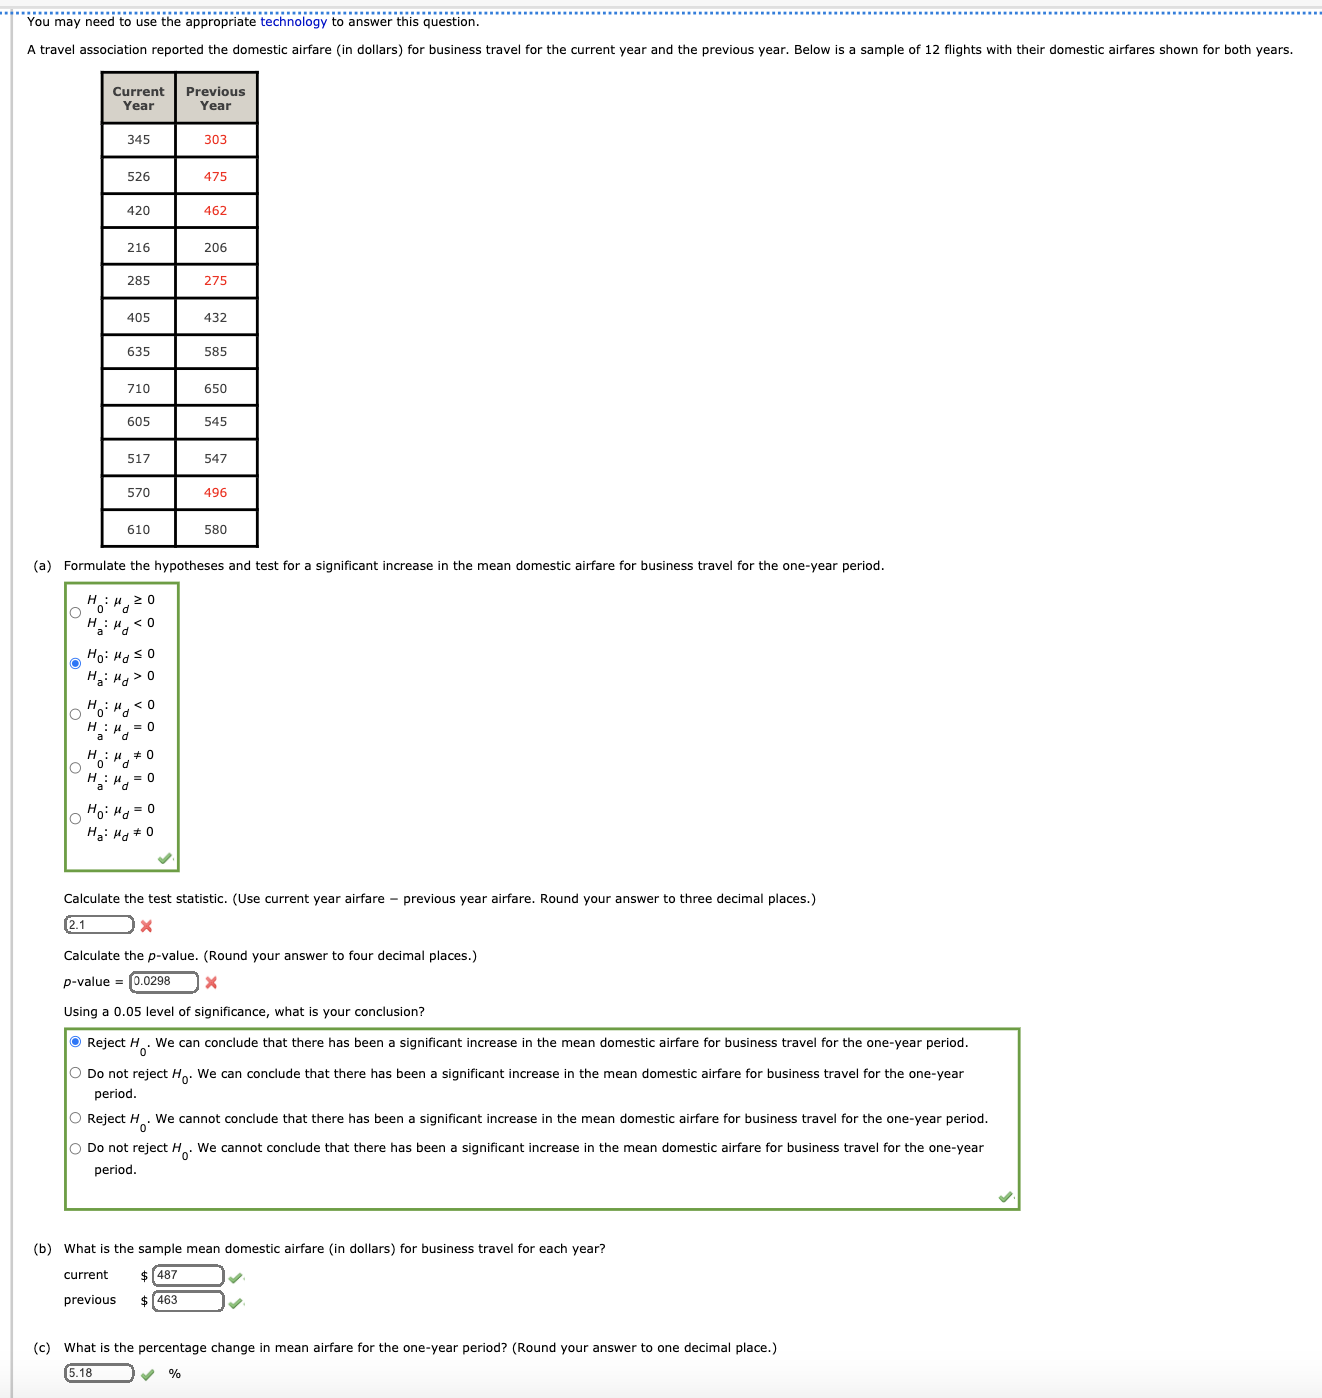
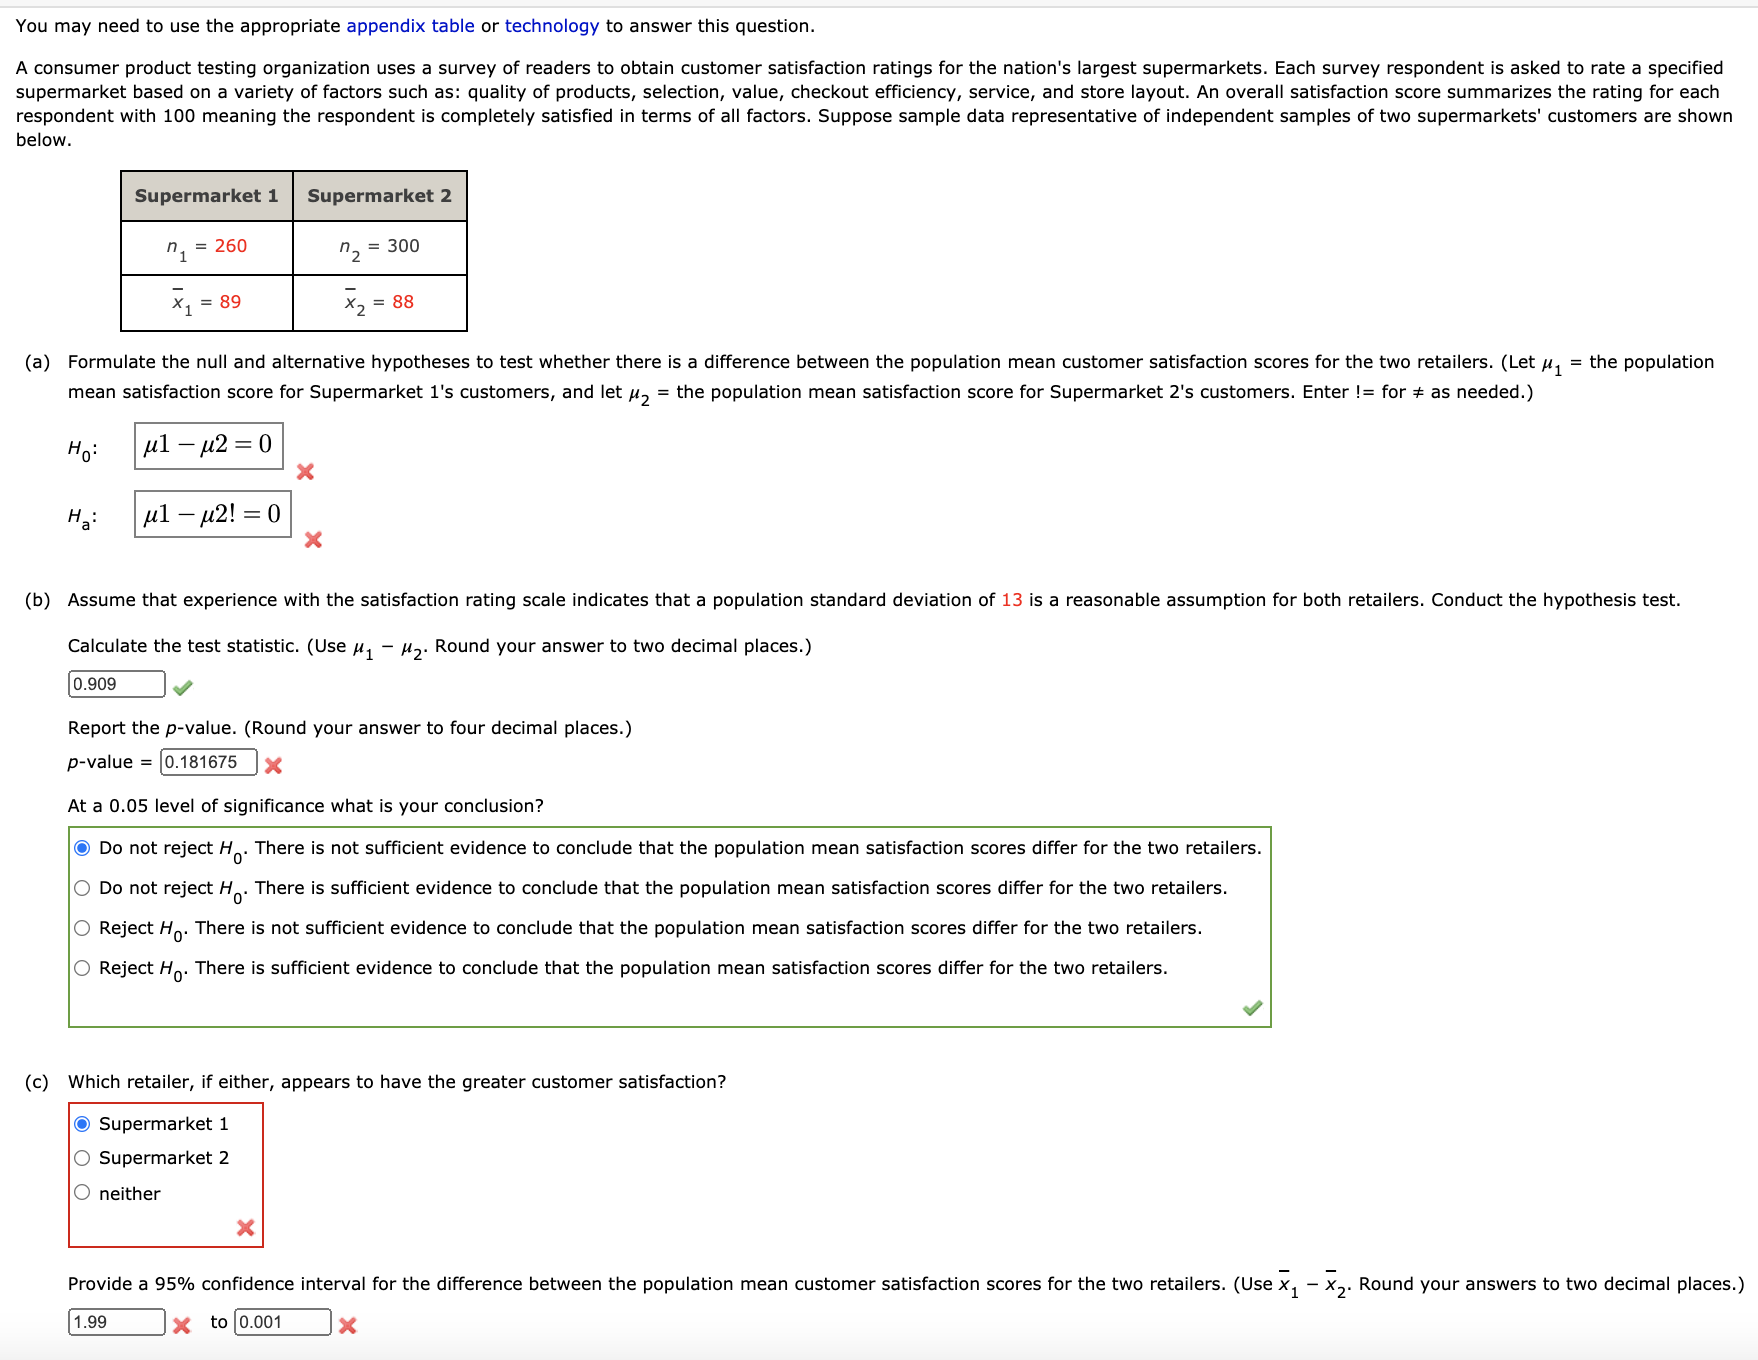
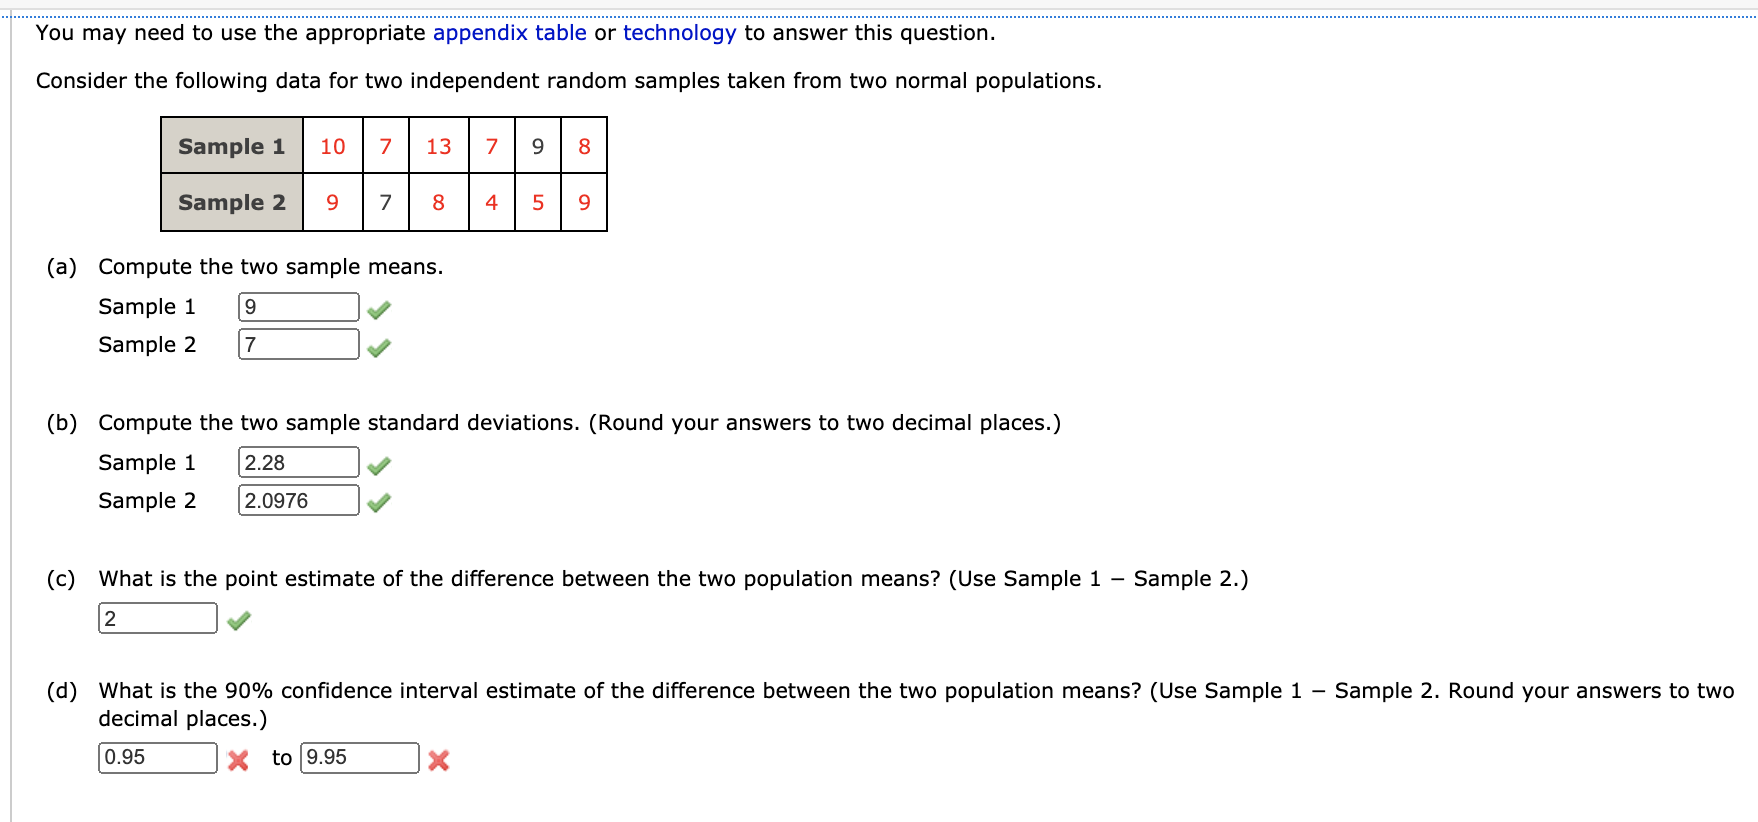
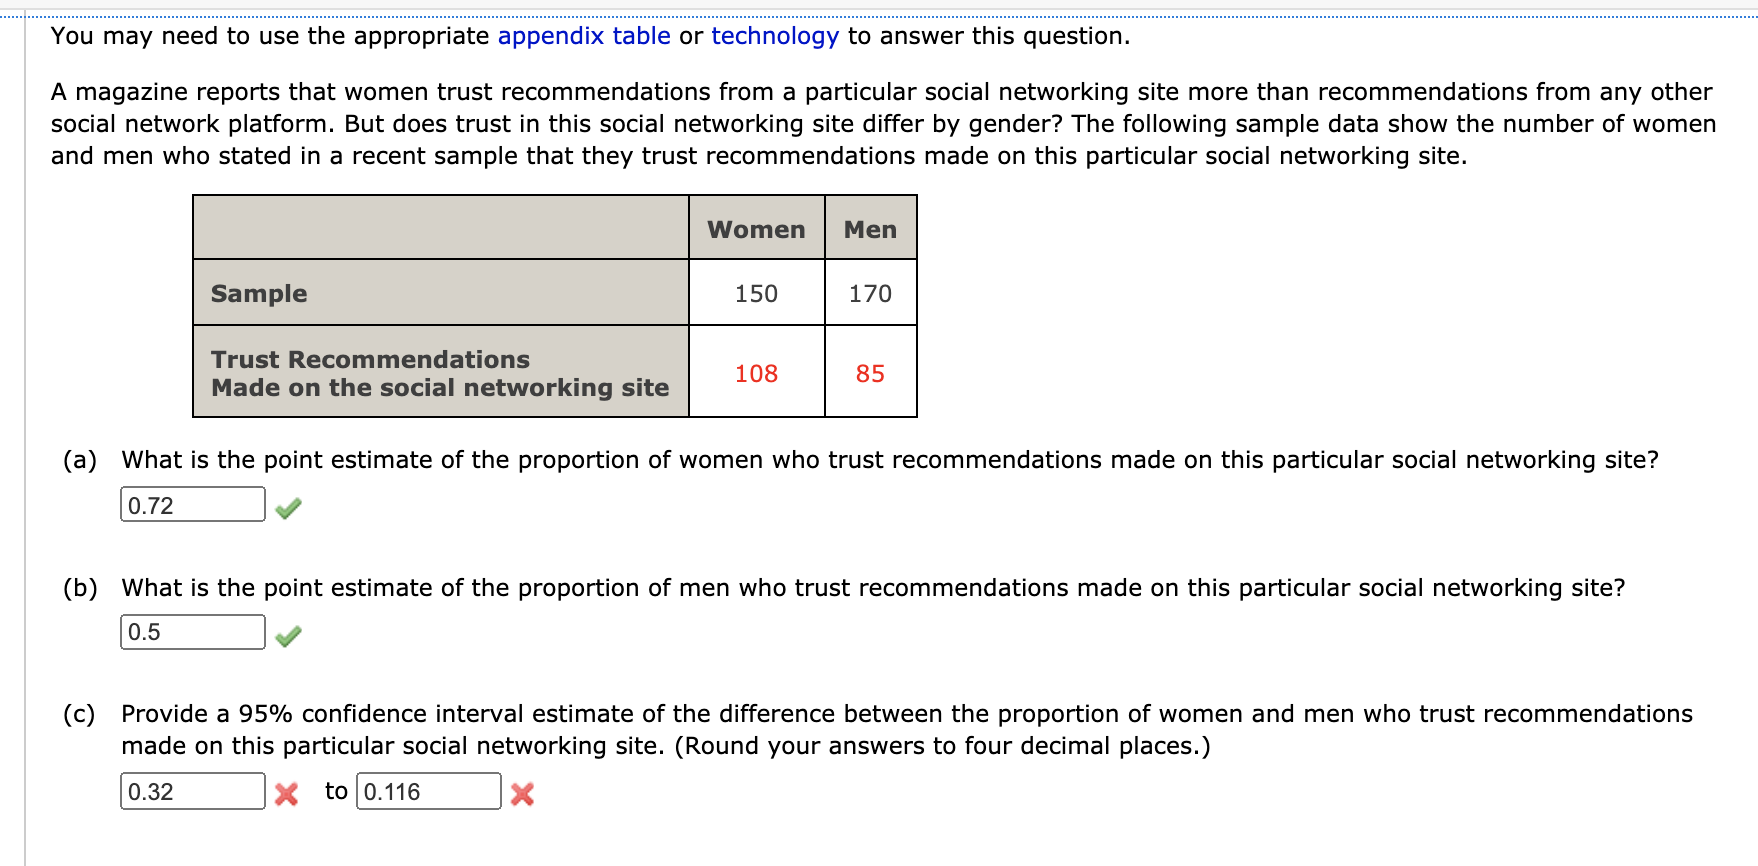
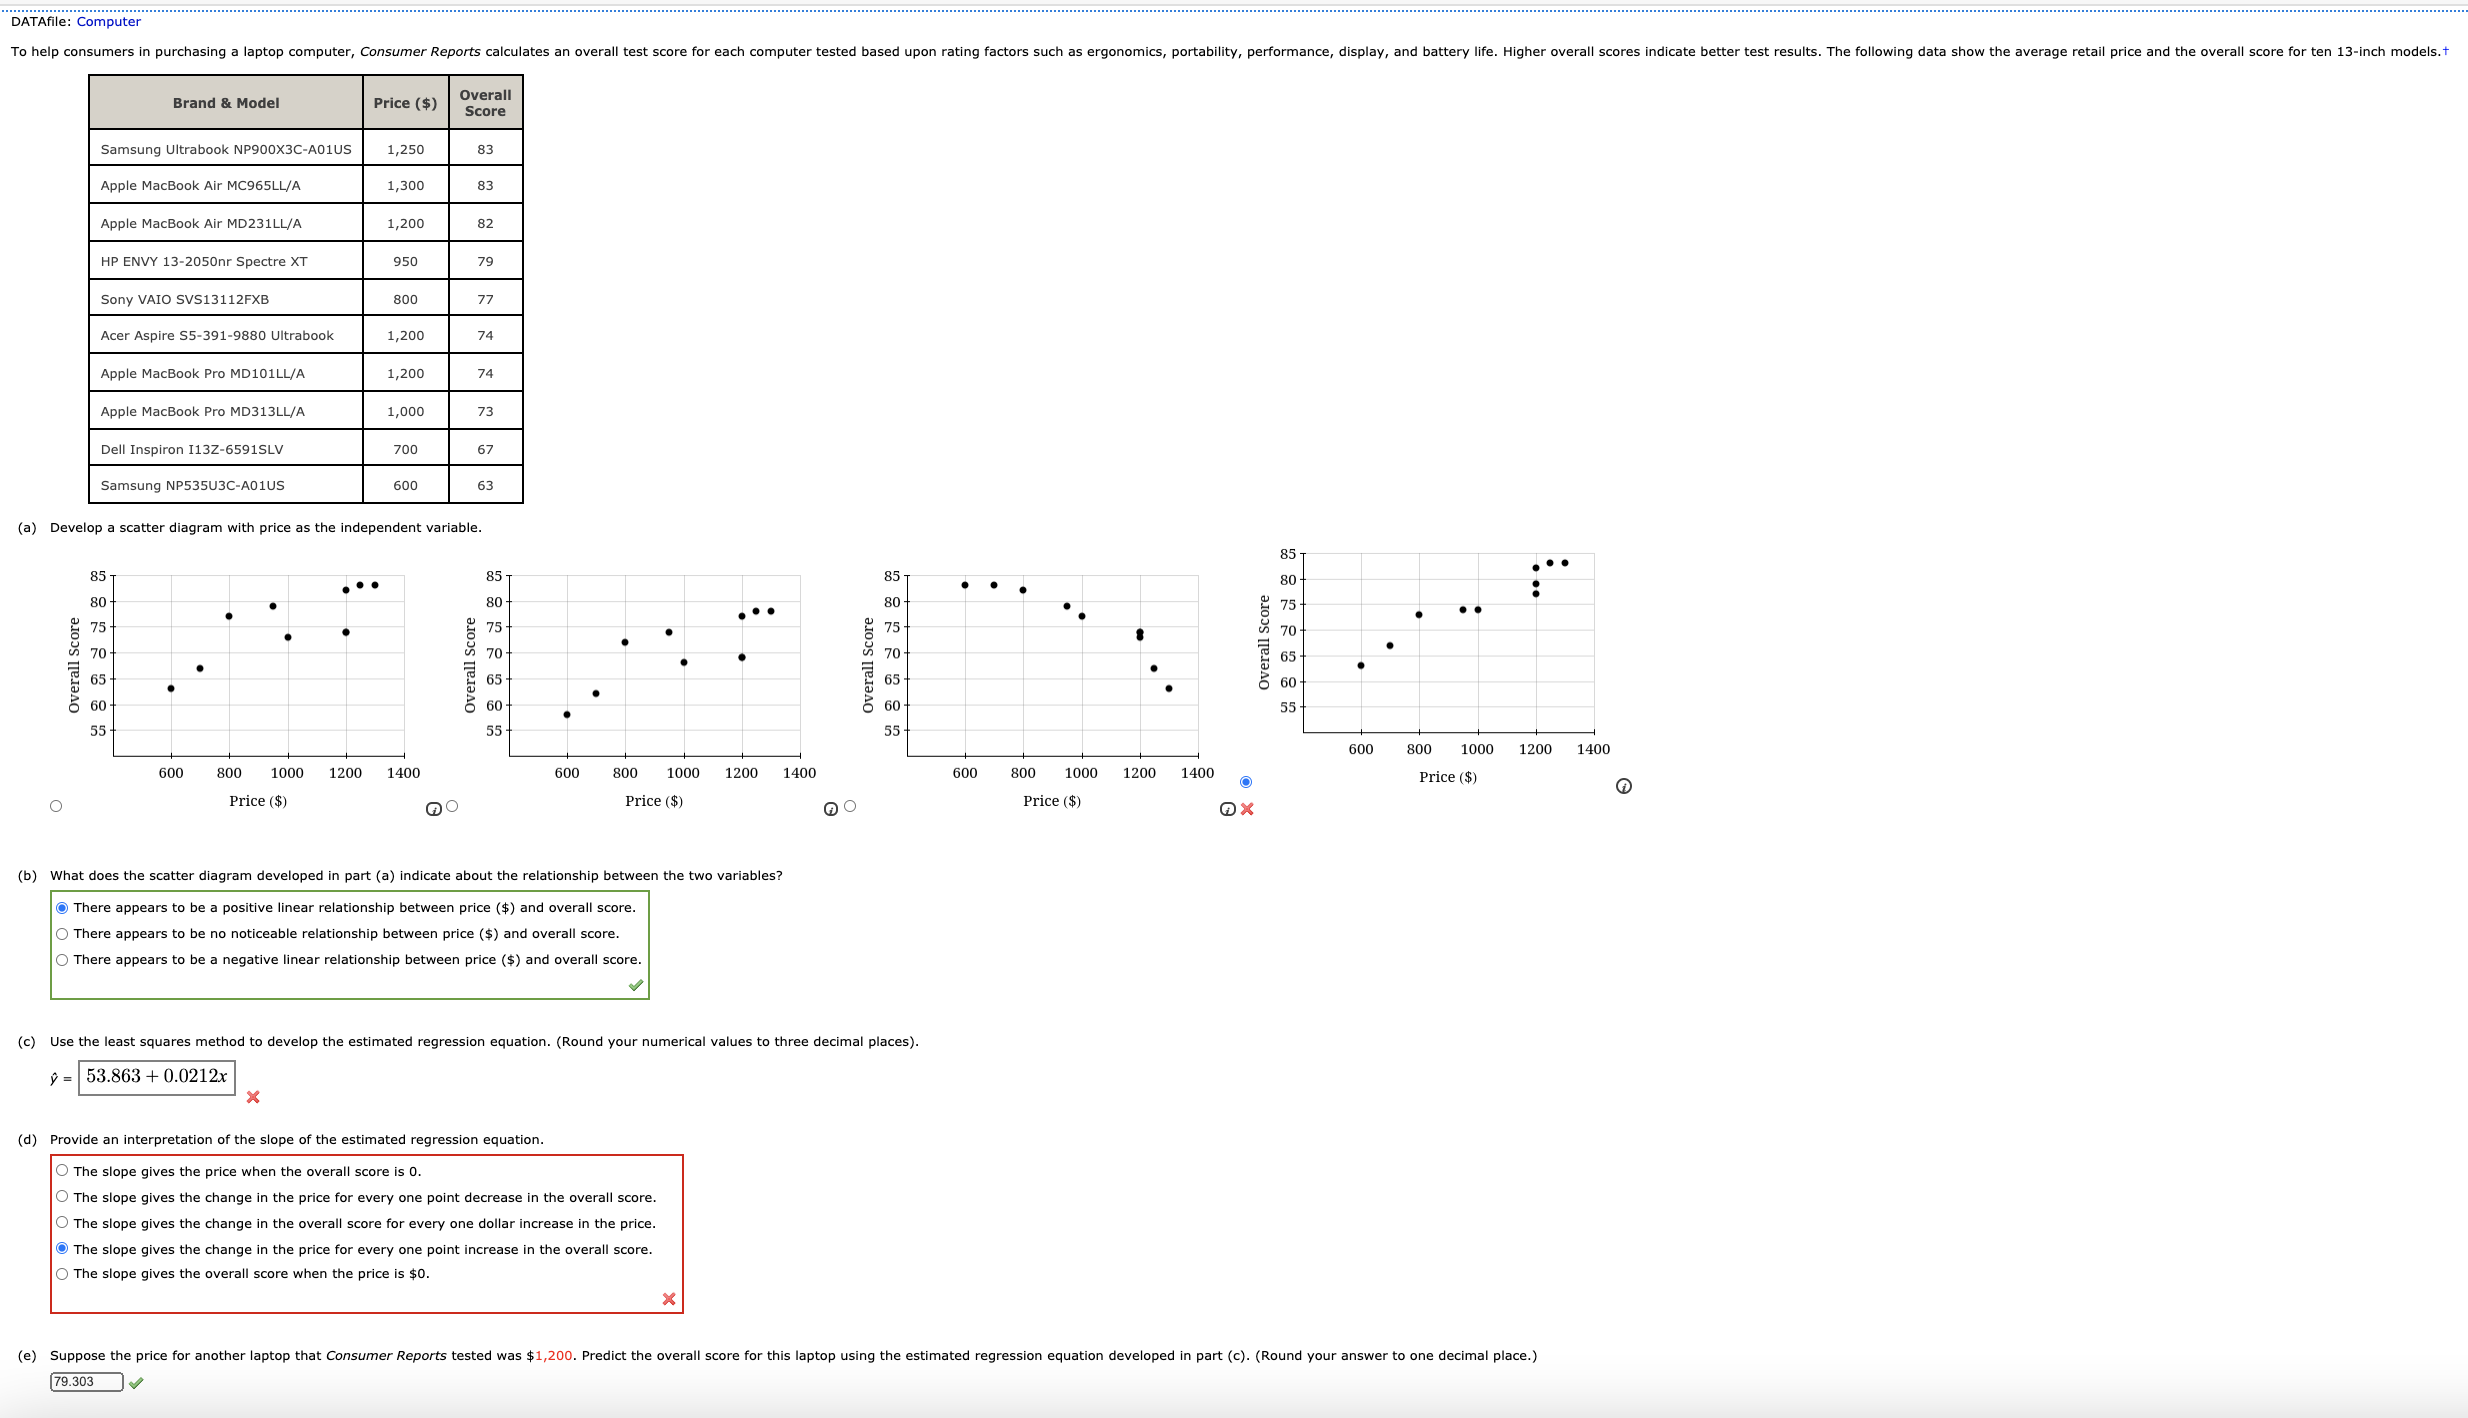
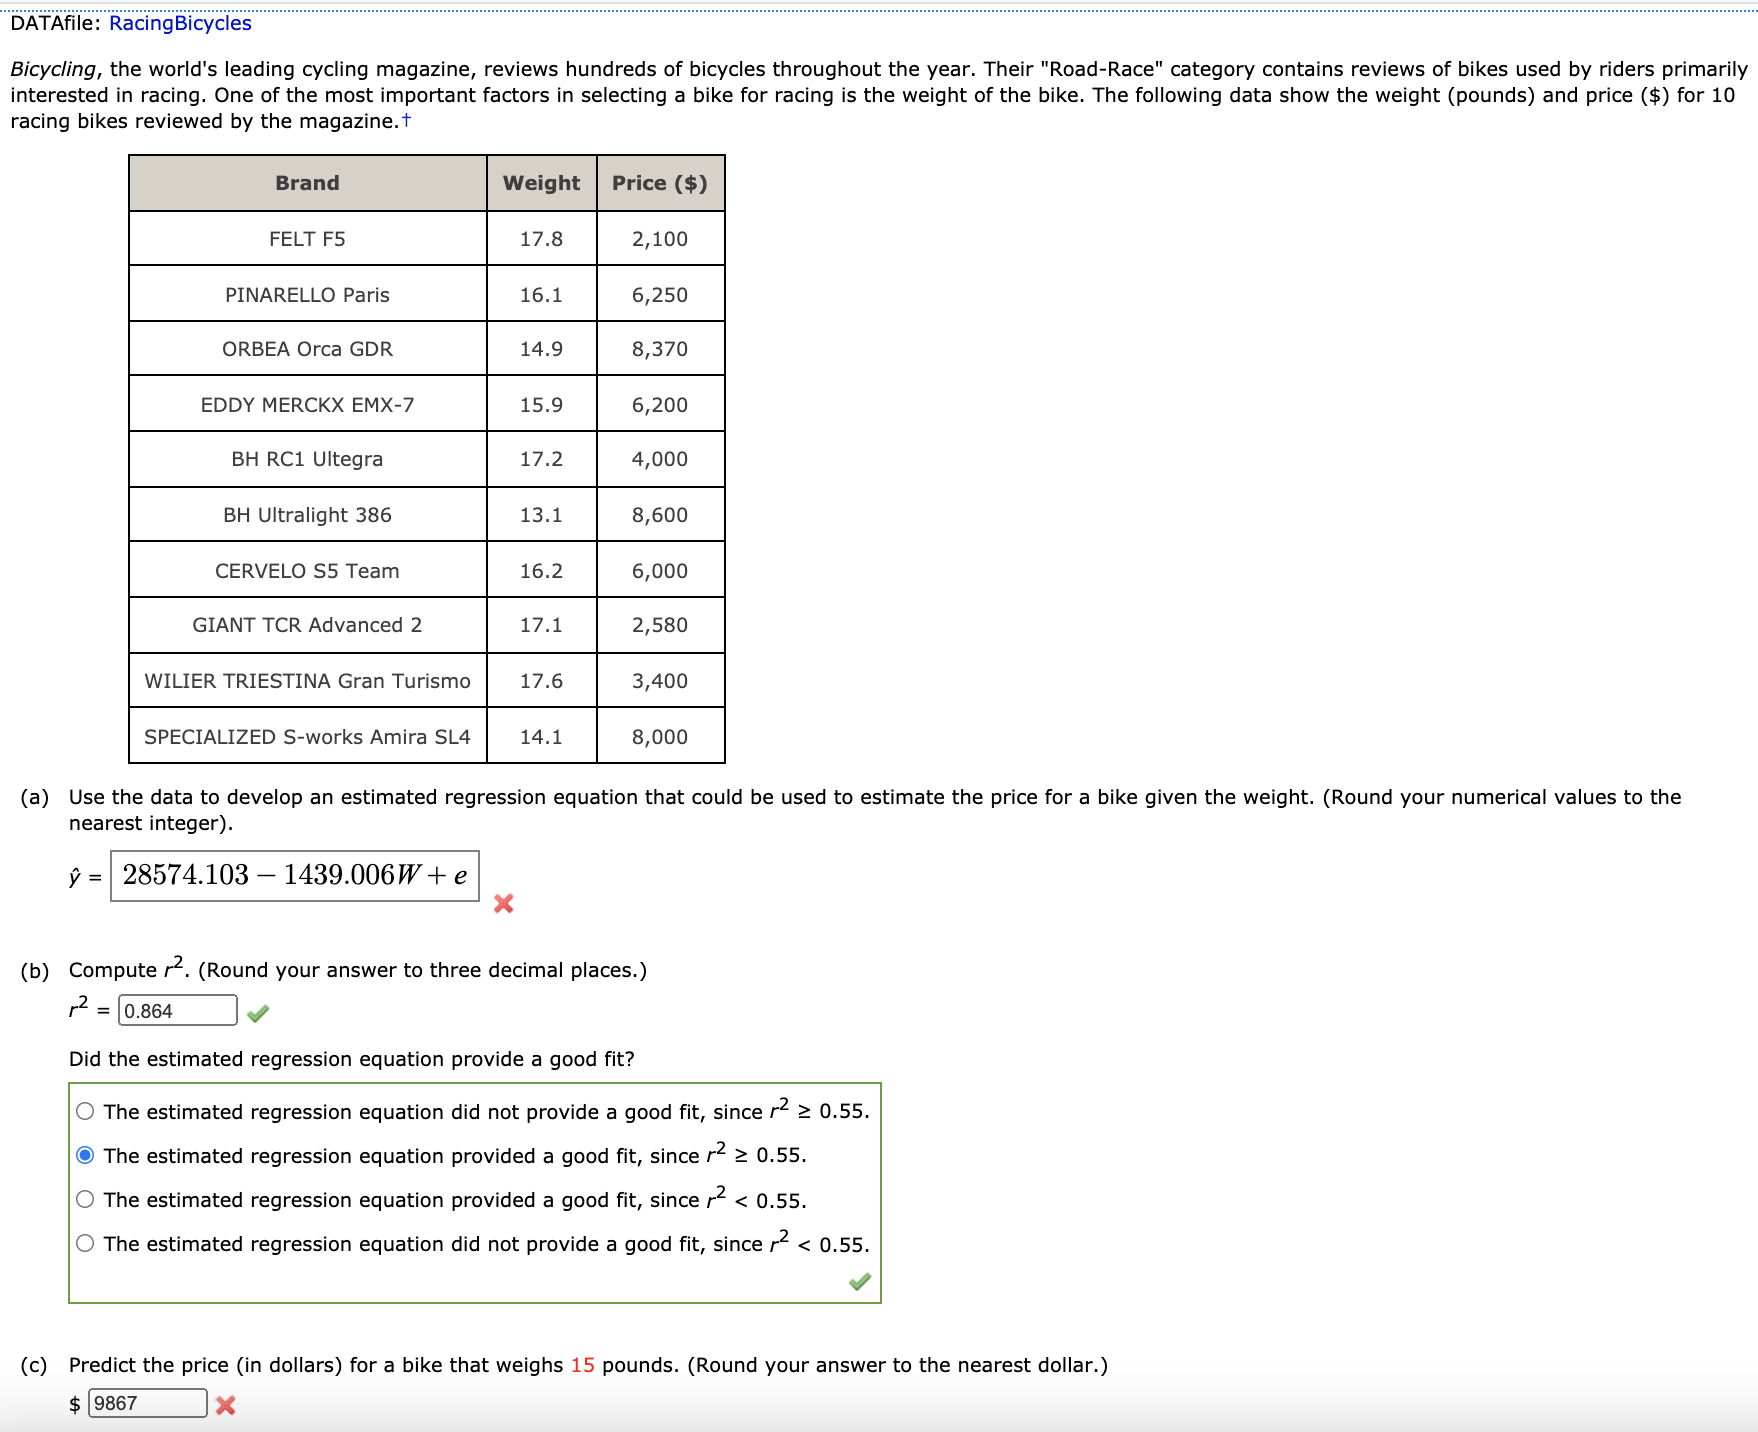
You may need to use the appropriate appendix table or technology to answer this question. The increasing annual cost (including tuition, room, board, books, and fees) to attend college has been widely discussed (Time.com). The following random samples show the annual cost of attending private and public colleges. Data are in thousands of dollars. Private Colleges Public Colleges Human mnmnm (a) Compute the sample mean (in thousand dollars) and sample standard deviation (in thousand dollars) for private colleges. (Round the standard deviation to two decimal places.) sample mean 1; 4 thousand sample standard deviation $ 6.682 g thousand Compute the sample mean (in thousand dollars) and sample standard deviation (in thousand dollars) for public colleges. (Round the standard deviation to two decimal places.) sample mean 5}; q thousand sample standard deviation 3; 4.532 ,f thousand (b) What is the point estimate (in thousand dollars) of the difference between the two population means? (Use Private Public.) $ V thousand Interpret this value in terms of the annual cost (in dollars) of attending private and public colleges. We estimate that the mean annual cost to attend private colleges is $ x more than the mean annual cost to attend public college (c) Develop a 95% condence interval (in thousand dollars) of the difference between the mean annual cost of attending private and public colleges. (Use Private Public. Round your answers to one decimal place.) $ X thousand to $ x thousand You may need to um the appropriate technology to answer this question. A travel association reported the domestic airfare (in dollars} for business travel for the current year and the previous year. Below is a sample of 12 Highs with their domestic airfares shown for both years. Calculate the test statistic. (Use current year airfare - previous year airfare. Round your answer to three decimal places.) -x Calculate the p-value. (Round your answer to four decimal places.) Using a 0.05 level of signlcance, what is your concluslon? Q Reject Ha. We can conclude that here has been a signicant increase in the mean domestic airfare for business travel for the one-year period. 0 Do not reject Ho. We can conclude that there has been a signicant increase in the mean domatic airfare for business travel for the one-year period. 0 Reject Ha. We cannot conclude that there has been a signicant increase in the mean domestic airfare for business travel for the one-year period. 0 Do not reject Ho. We cannot conclude that there has been a signicant increase in the mean domwtic airfare for business travel for the one-year period. (b) What is the sample mean domestic airfare (in dollars] for business travel for each year? current s-.'. m... s-- (c) What is the percentage change in mean airfare for the one-year period? (Round your answer to one decimal place.) I -% You may need to use the appropriate appendix table or technology to answer this question. A consumer product testing organization uses a survey of readers to obtain customer satisfaction ratings for the nation's largest supermarkets. Each survey respondent is asked to rate a specified supermarket based on a variety of factors such as: quality of products, selection, value, checkout efficiency, service, and store layout. An overall satisfaction score summarizes the rating for each respondent with 100 meaning the respondent is completely satisfied in terms of all factors. Suppose sample data representative of independent samples of two supermarkets' customers are shown below. Supermarket 1 Supermarket 2 n = 260 n2 = 300 X1 = 89 * 2 = 88 (a) Formulate the null and alternative hypotheses to test whether there is a difference between the population mean customer satisfaction scores for the two retailers. (Let , = the population mean satisfaction score for Supermarket 1's customers, and let /2 = the population mean satisfaction score for Supermarket 2's customers. Enter != for # as needed.) Ho ul - M2 = 0 X ul - u2! = 0 (b) Assume that experience with the satisfaction rating scale indicates that a population standard deviation of 13 is a reasonable assumption for both retailers. Conduct the hypothesis test. Calculate the test statistic. (Use M1 - M2. Round your answer to two decimal places.) 0.909 Report the p-value. (Round your answer to four decimal places.) p-value = 0.181675 x At a 0.05 level of significance what is your conclusion? Do not reject H . There is not sufficient evidence to conclude that the population mean satisfaction scores differ for the two retailers. O Do not reject H . There is sufficient evidence to conclude that the population mean satisfaction scores differ for the two retailers. O Reject Ho. There is not sufficient evidence to conclude that the population mean satisfaction scores differ for the two retailers. O Reject Ho. There is sufficient evidence to conclude that the population mean satisfaction scores differ for the two retailers. (c) Which retailer, if either, appears to have the greater customer satisfaction? Supermarket 1 O Supermarket 2 O neither X Provide a 95% confidence interval for the difference between the population mean customer satisfaction scores for the two retailers. (Use x, - x2. Round your answers to two decimal places.) 1.99 x to 0.001 JXYou may need to use the appropriate appendix table or technology to answer this question. Consider the following data for two independent random samples taken from two normal populations. Sample 1 10 7 13 7 8 Sample 2 C 8 4 5 9 (a) Compute the two sample means. Sample 1 9 Sample 2 7 (b) Compute the two sample standard deviations. (Round your answers to two decimal places.) Sample 1 2.28 Sample 2 2.0976 (c) What is the point estimate of the difference between the two population means? (Use Sample 1 - Sample 2.) 2 (d) What is the 90% confidence interval estimate of the difference between the two population means? (Use Sample 1 - Sample 2. Round your answers to two decimal places.) 0.95 X to 9.95A magazine reports that women trust recommendations from a particular social networking site more than recommendations from any other social network platform. But does trust in this social networking site differ by gender? The following sample data show the number of women and men who stated in a recent sample that they trust recommendations made on this particular social networking site. Women Men 150 170 Trust Recommendations 108 Made on the social networking site (a) What is the point estimate of the proportion of women who trust recommendations made on this particular social networking site? _ (b) What is the point estimate of the proportion of men who trust recommendations made on this particular social networking site? _ (c) Provide a 95% confidence interval estimate of the difference between the proportion of women and men who trust recommendations made on this particular social networking site. (Round your answers to four decimal places.) x to_x DATAfile: Computer To help consumers in purchasing a laptop computer, Consumer Reports calculates an overall test score for each computer tested b ed upon rating factors such Brand & Model Price ($) Overall Score Samsung Ultrabook NP900X3C-AO1US 1,250 83 Apple MacBook Air MC965LL/A 1,300 83 Apple MacBook Air MD231LL/A 1,200 82 HP ENVY 13-2050nr Spectre XT 950 79 Sony VAIO SVS13112FXE 800 77 Acer Aspire $5-391-9880 Ultraboo 1,20 74 Apple MacBook Pro MD101LL/A 1,200 74 Apple MacBook Pro MD313LL/A 1,000 73 Dell Inspiron I13Z-6591SLV 700 67 Samsung NP53503C-AOIUS 600 63 (a) Develop a scatter diagram with price as the independent variable. 85 85 85 . 80 .. 80 - 80 . . . . 75 75 8 7 70 verall s 65 + Overall Score Overall Score 65 8 6 55 55 600 1000 1200 1400 600 800 1000 1200 1400 600 800 1000 1200 600 800 1000 1200 1400 O Price ($) O Price ($) Price ($) Price ($) (b) What does the scatter diagram developed in part (a) indicate about the relationship between the two variables? There appears to be a en price ($) and overall score. There appears to be no noticeable relationship between price ($) and overall score. There appears to be a negative linear relationship between price ($) and overall score. (c) Use the least squares method to develop the estimated regression equation. (Round your numerical values to three decimal places). = 53.863 + 0.0212x (d) Provide an interpretation of the slope of the estimated regression equation. The slope gives the price when the overall score is 0. The slope gives the change in the price for every one point decrease in the overall score. The slope gives the change in the overall score for every one dollar increase in the price. The slope gives the change in the price for every one point increase in the overall score. The slope gives the overall score when the price is $0. (e) Suppose the price for another laptop that Consumer Reports tested was $1,200. Predict the overall score for this laptop using the estimated regression equation developed in part (c). (Round your answer to one decimal place.) 79.303DATAIeRacmgBIcycles Bicycling, the world's leading cycling magazine, reviews hundreds of bicycles throughout the year. Their "Road-Race" category contains reviews of bikes used by riders primarily interested in racing. One of the most important factors in selecting a bike for racing is the weight of the bike. The following data show the weight (pounds) and price ($) for 10 racing bikes reviewed by the magazine.T Brand Weight Price ($) FELT F5 . 2,100 PINARELLO Paris . 6,250 ORBEA Orca GDR . 8,370 EDDY MERCKX EMX-7 . 6,200 SH RC1 Ultegra . 4,000 BH Ultralight 386 . 8,600 CERVELO SS Team . 6,000 GIANT TCR Advanced 2 . 2,580 WILIER TRIESTINA Gran Turismo . 3,400 SPECIALIZED S-works Amira SL4 . 8,000 (a) Use the data to develop an estimated regression equation that could be used to estimate the price for a bike given the weight. (Round your numerical values to the nearest integer). 9 = 28574.103 1439.006W+ e X (b) Compute r2. (Round your answer to three decimal places.) .2-_, Did the estimated regression equation provide a good fit? 0 The estimated regression equation did not provide a good fit, since r2 2 0.55. The estimated regression equation provided a good t, since r2 2 0.55. 2 O The estimated regression equation provided a good t, since r