Question: Question 11 (1 point) The equation that describes how the dependent variable (y) is related to the independent variable (x) is called the correlation model
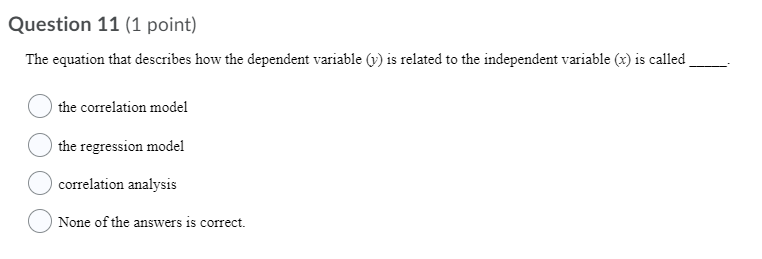
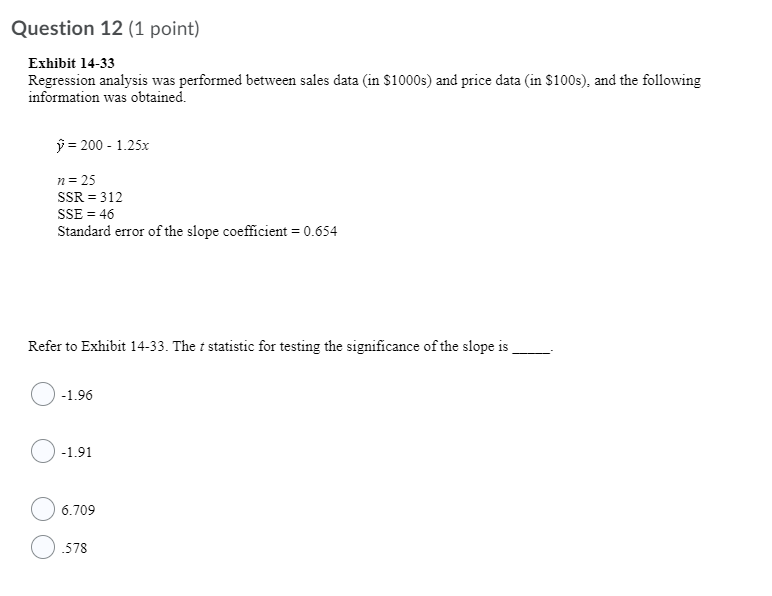

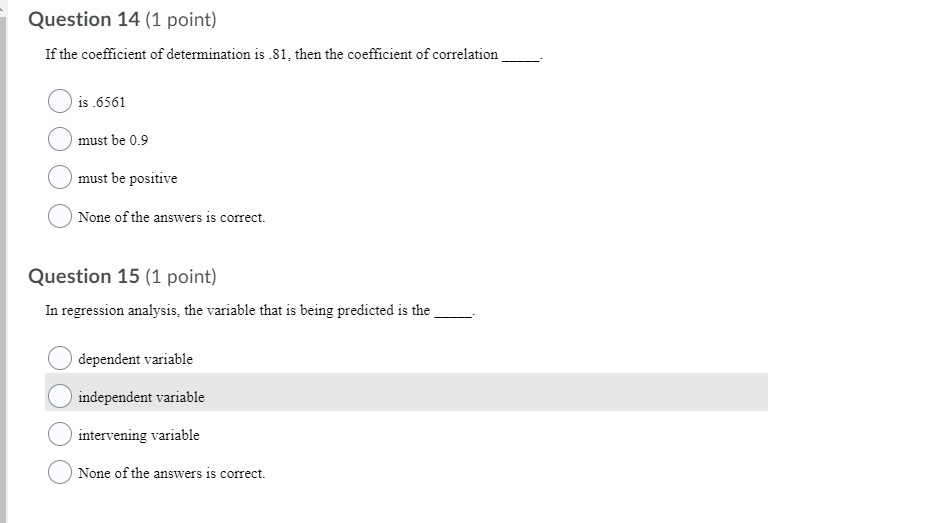
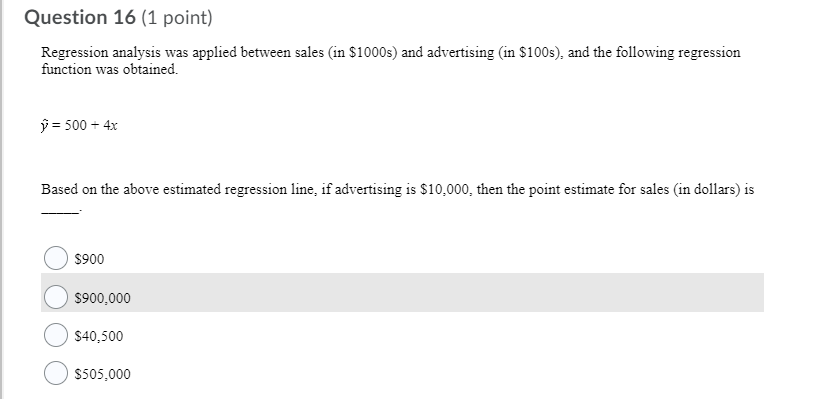

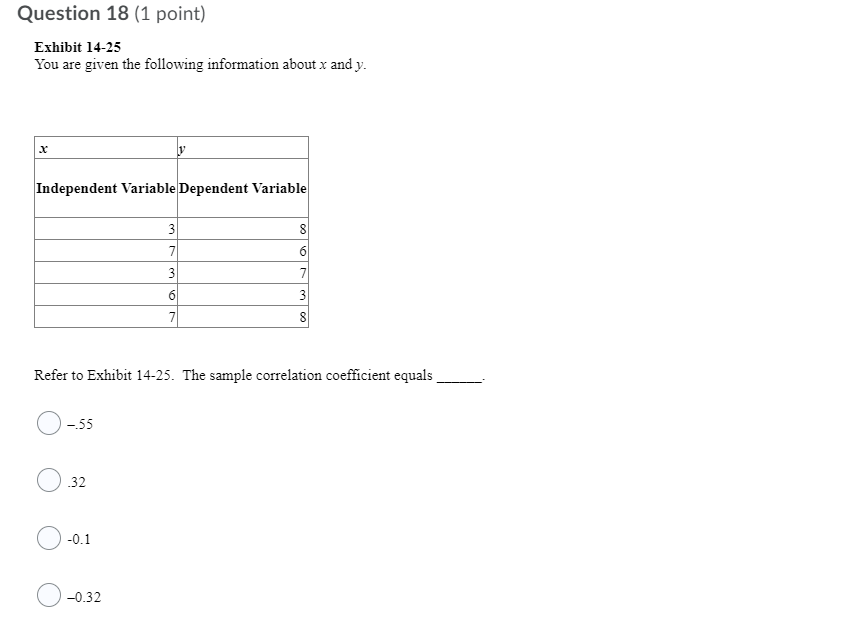
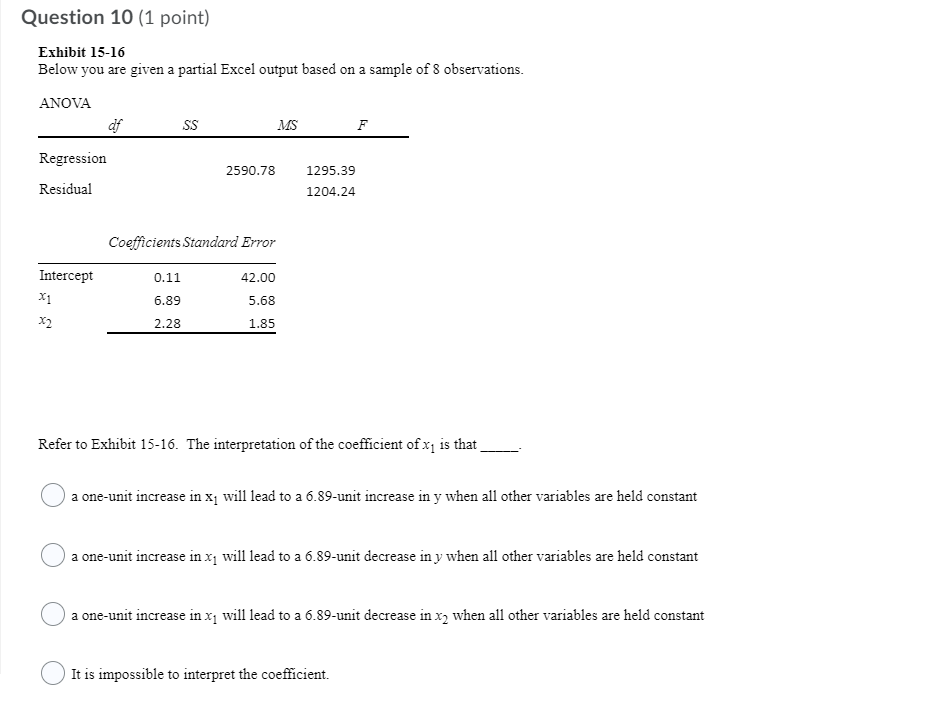
Question 11 (1 point) The equation that describes how the dependent variable (y) is related to the independent variable (x) is called the correlation model the regression model O correlation analysis None of the answers is correct.Question 12 (1 point) Exhibit 14-33 Regression analysis was performed between sales data (in $1000s) and price data (in $100s), and the following information was obtained. P = 200 - 1.25x n = 25 SSR = 312 SSE = 46 Standard error of the slope coefficient = 0.654 Refer to Exhibit 14-33. The : statistic for testing the significance of the slope is O-1.96 O-1.91 6.709 .578In regression analysis, if the dependent variable is measured in dollars, the independent variable O must also be in dollars must be in some unit of currency OOO can be any units cannot be in dollarsQuestion 14 (1 point) If the coefficient of determination is .81, then the coefficient of correlation O O must be 0.9 O must be positive None of the answers is correct. Question 15 (1 point) In regression analysis, the variable that is being predicted is the O dependent variable independent variable C intervening variable O None of the answers is correct.Question 16 (1 point) Regression analysis was applied between sales (in $1000s) and advertising (in $1005), and the following regression function was obtained. f=5{][}4x Based on the above estimated regression line= if advertising is MEMO, then the point estimate for sales (in dollars) is Question 17 (1 point) In a regression analysis, the variable that is used to predict the dependent variable must have the same units as the variable doing the predicting O is the independent variable O is the dependent variable O usually is denoted by xQuestion 18 (1 point) Exhibit 14-25 You are given the following information about x and y. Independent Variable Dependent Variable 31 Refer to Exhibit 14-25. The sample correlation coefficient equals O-.55 .32 O-0.1 O-0.32Question 10 (1 point) Exhibit 15-16 Below you are given a partial Excel output based on a sample of 8 observations. ANOVA df SS MS F Regression 2590.78 1295.39 Residual 1204.24 Coefficients Standard Error Intercept 0.11 42.00 X1 6.89 5.68 2.28 1.85 Refer to Exhibit 15-16. The interpretation of the coefficient of x is that a one-unit increase in x1 will lead to a 6.89-unit increase in y when all other variables are held constant O a one-unit increase in x1 will lead to a 6.89-unit decrease in y when all other variables are held constant O a one-unit increase in x, will lead to a 6.89-unit decrease in xy when all other variables are held constant It is impossible to interpret the coefficient
Step by Step Solution
There are 3 Steps involved in it

Get step-by-step solutions from verified subject matter experts


