Question 11 - Interactive Assignn X Course Hero X + V X C A ezto.mheducation.com/ext/map/index.html?_con=con&external_browser=0&launchUrl=https%253A%252F%252Fnewconnect.mheducation.com%252F#/activity/q... @ @ * . .. Interactive Assignment: Regression SEVEE Help
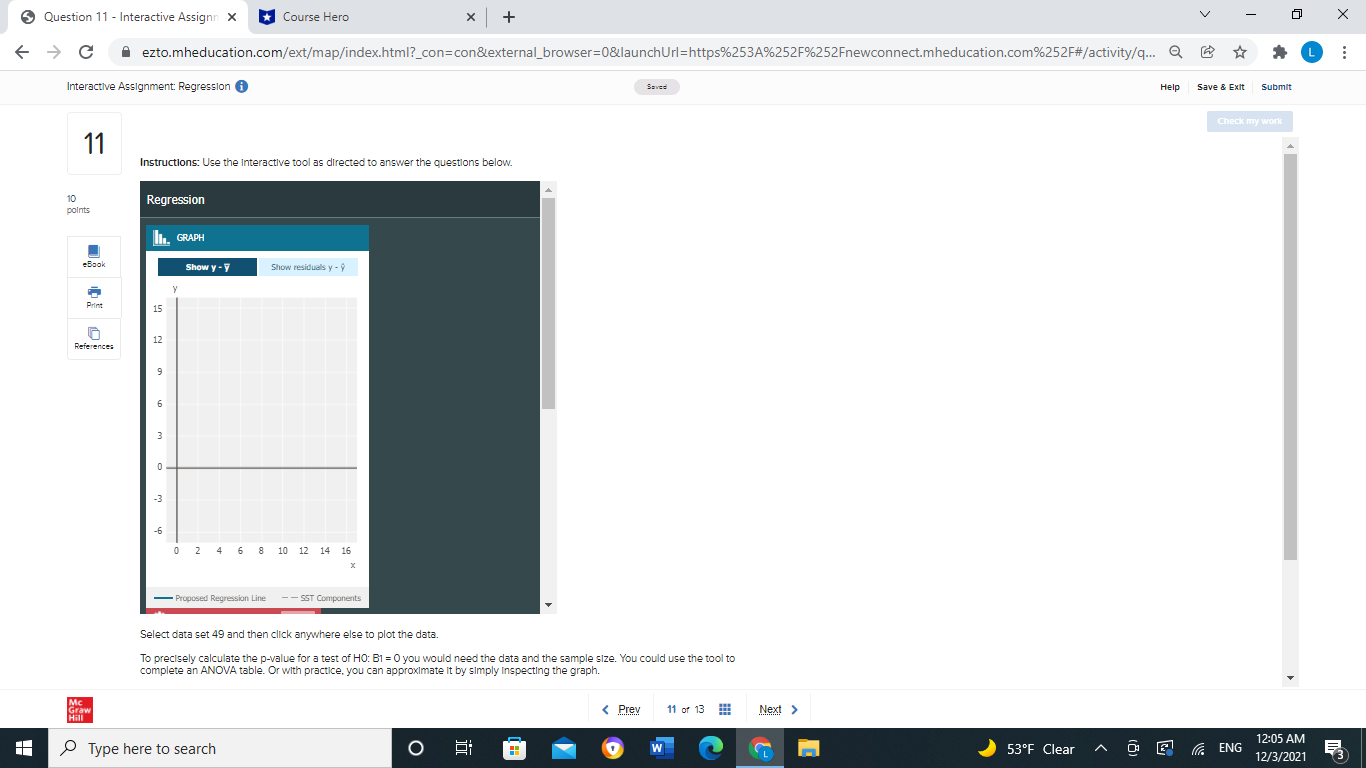
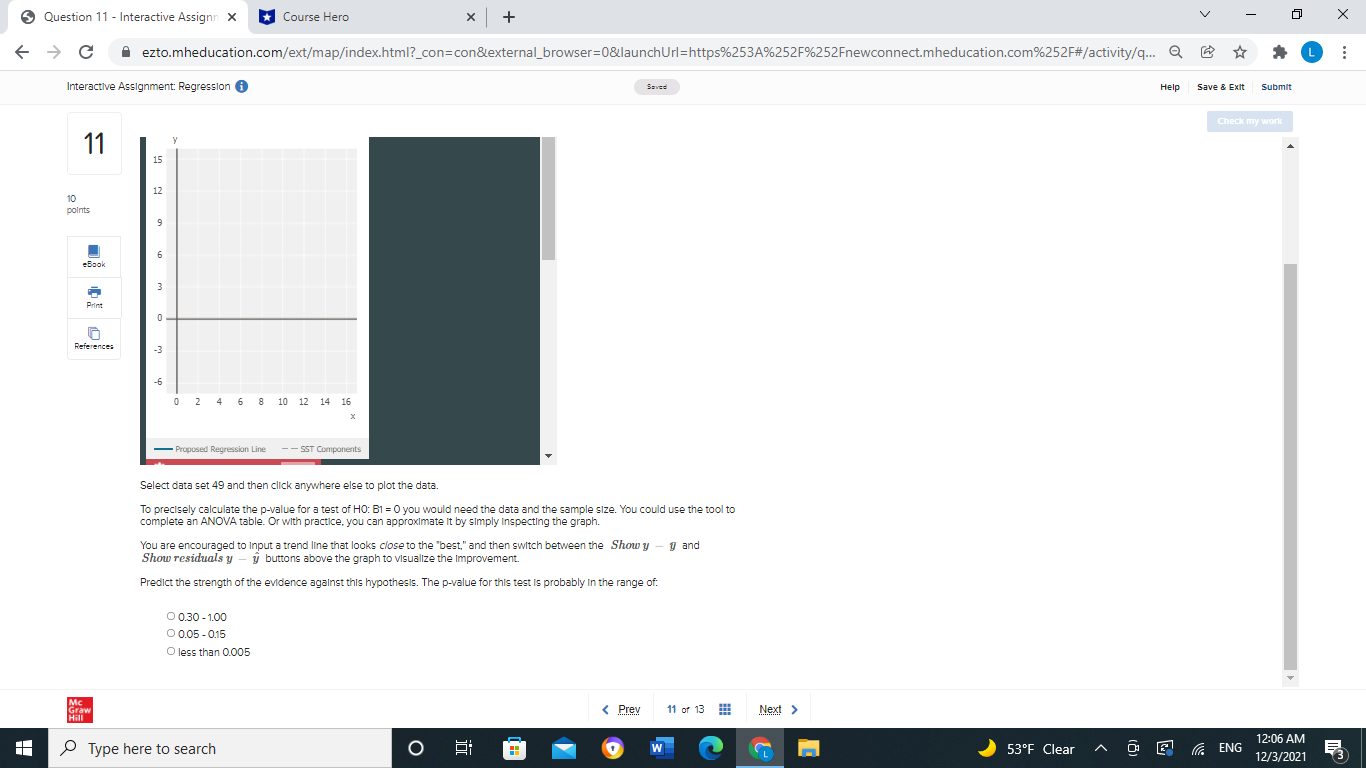
Question 11 - Interactive Assignn X Course Hero X + V X C A ezto.mheducation.com/ext/map/index.html?_con=con&external_browser=0&launchUrl=https%253A%252F%252Fnewconnect.mheducation.com%252F#/activity/q... @ @ * . .. Interactive Assignment: Regression SEVEE Help Save & Exit Submit Check my work 11 Instructions: Use the Interactive tool as directed to answer the questions below. 10 Regression points I. GRAPH eBook Show y - y Show residuals y - Print 15 12 References LD W O -3 -6 0 2 4 6 8 10 12 14 16 - Proposed Regression Line - - SST Components Select data set 49 and then click anywhere else to plot the data. To precisely calculate the p-value for a test of HO: B1 = 0 you would need the data and the sample size. You could use the tool to complete an ANOVA table. Or with practice, you can approximate It by simply Inspecting the graph. 12:05 AM H Type here to search O O W 53'F Clear ~ 9 ENG 12/3/2021 53Question 11 - Interactive Assignn X Course Hero X + V X C A ezto.mheducation.com/ext/map/index.html?_con=con&external_browser=0&launchUrl=https%2530%252F%252Fnewconnect.mheducation.com%252F#/activity/q... @ @ * . .. Interactive Assignment: Regression SEVEE Help Save & Exit Submit Check my work 11 15 12 10 points LD w Print O References -6 2 4 6 8 10 12 14 16 - Proposed Regression Line - - SST Components Select data set 49 and then click anywhere else to plot the data To precisely calculate the p-value for a test of HO: B1 = 0 you would need the data and the sample size. You could use the tool to complete an ANOVA table. Or with practice, you can approximate it by simply Inspecting the graph. You are encouraged to Input a trend line that looks close to the "best," and then switch between the Showy - y and Show residuals y - y buttons above the graph to visualize the Improvement. Predict the strength of the evidence against this hypothesis. The p-value for this test is probably in the range of. O 0.30 - 1.00 0 0.05 - 0.15 O less than 0.005 12:06 AM Type here to search O O W 53'F Clear ~ 9 ENG 12/3/2021 53
Step by Step Solution
There are 3 Steps involved in it
Step: 1
Get Instant Access to Expert-Tailored Solutions
See step-by-step solutions with expert insights and AI powered tools for academic success
Step: 2
Step: 3
Ace Your Homework with AI
Get the answers you need in no time with our AI-driven, step-by-step assistance