

Answered step by step
Verified Expert Solution
Question
1 Approved Answer
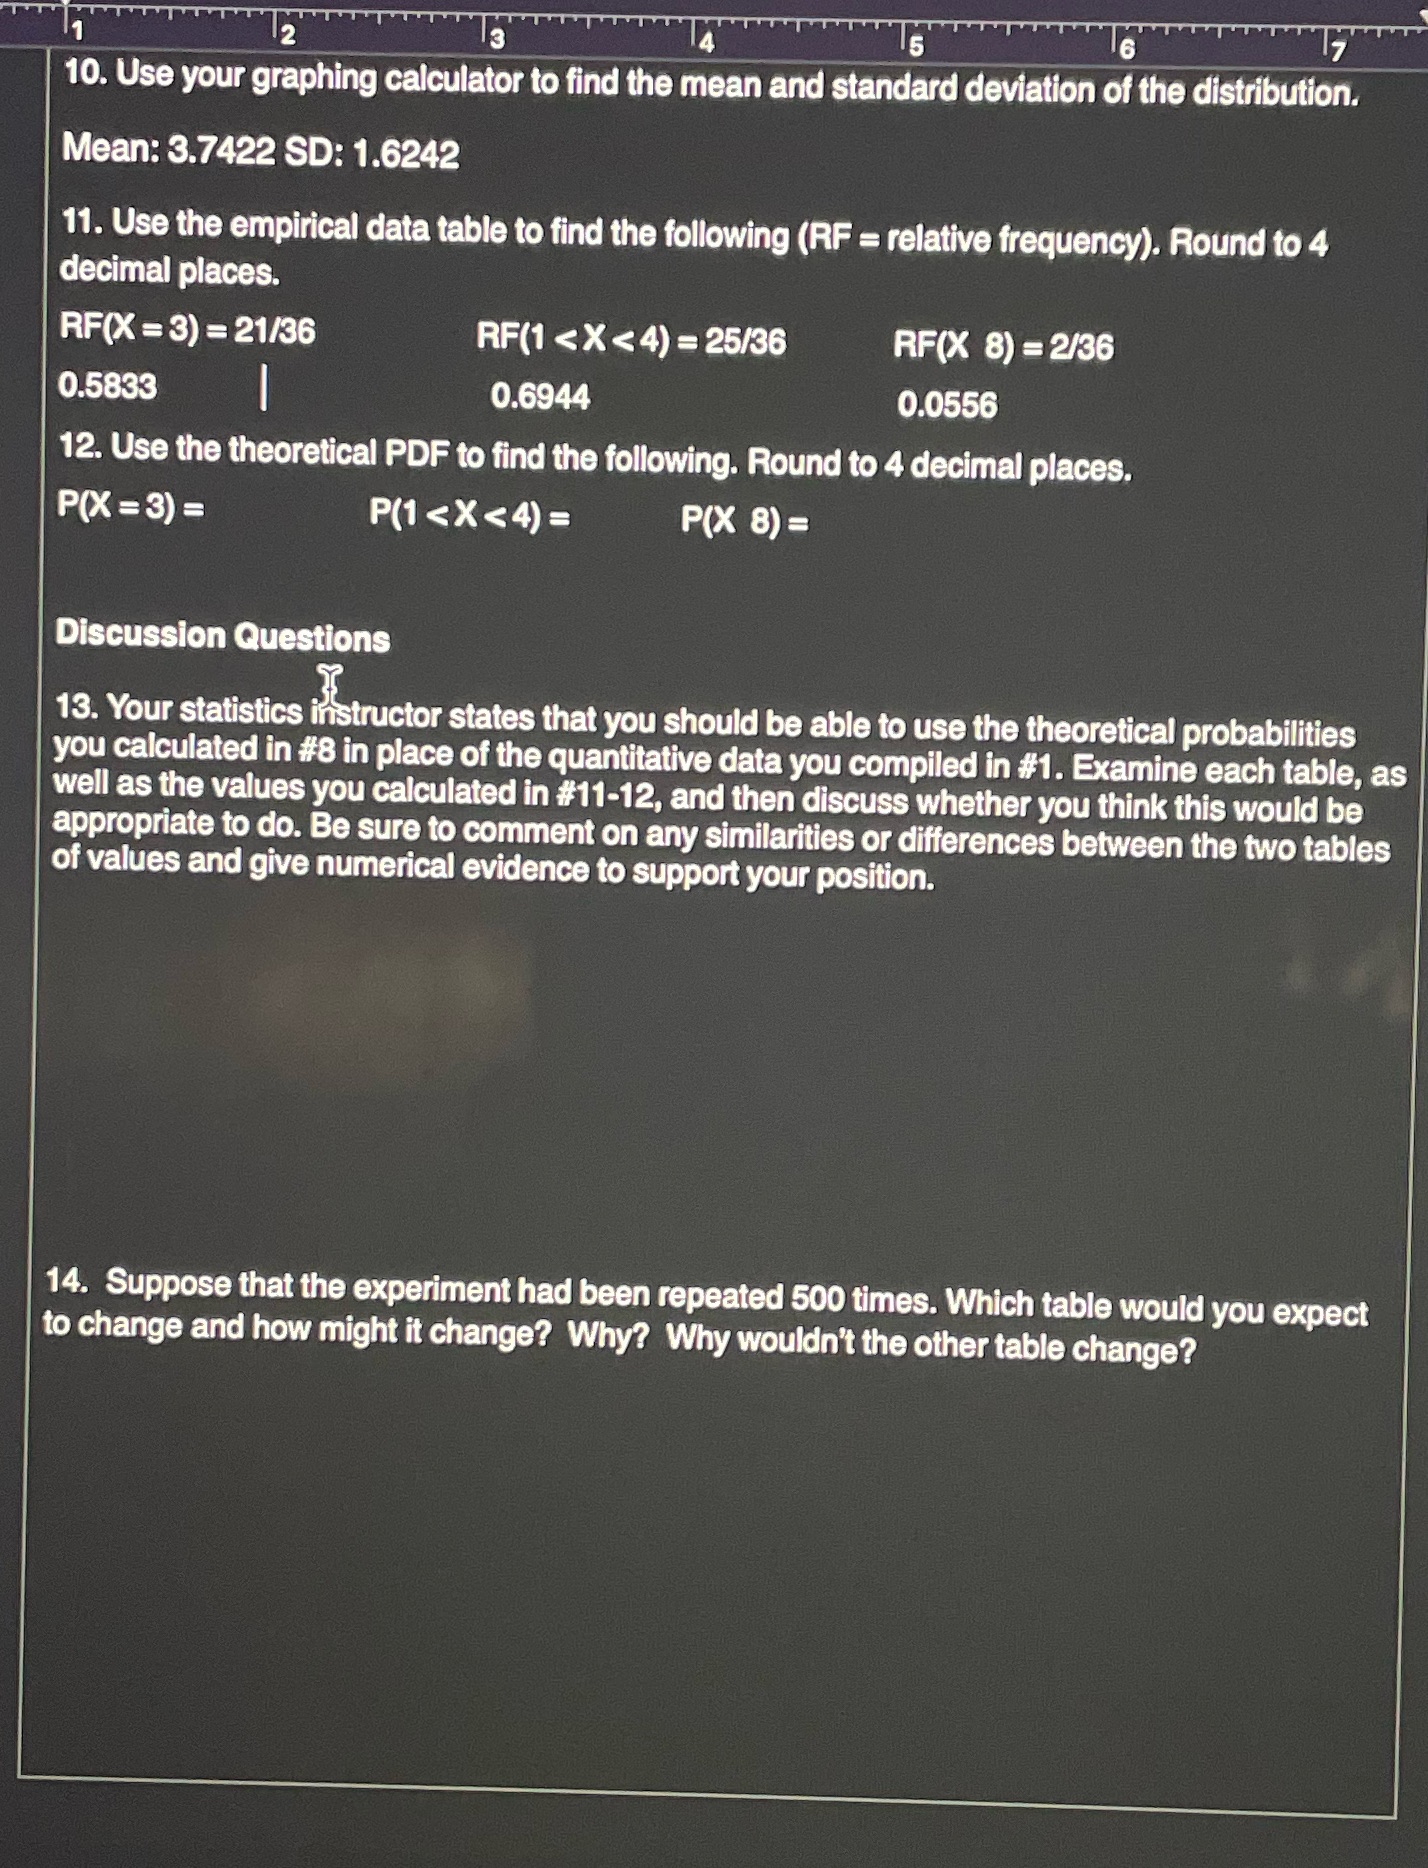
Question 12, 13, 14 2 13 5 16 10. Use your graphing calculator to find the mean and standard deviation of the distribution. Mean: 3.7422
Question 12, 13, 14
Step by Step Solution
There are 3 Steps involved in it
Step: 1

Get Instant Access to Expert-Tailored Solutions
See step-by-step solutions with expert insights and AI powered tools for academic success
Step: 2

Step: 3
Ace Your Homework with AI
Get the answers you need in no time with our AI-driven, step-by-step assistance
Get Started
Algebra (subscription)
Authors: Elayn Martin Gay
6th Edition
0135176301, 9780135176306