

Answered step by step
Verified Expert Solution
Question
1 Approved Answer
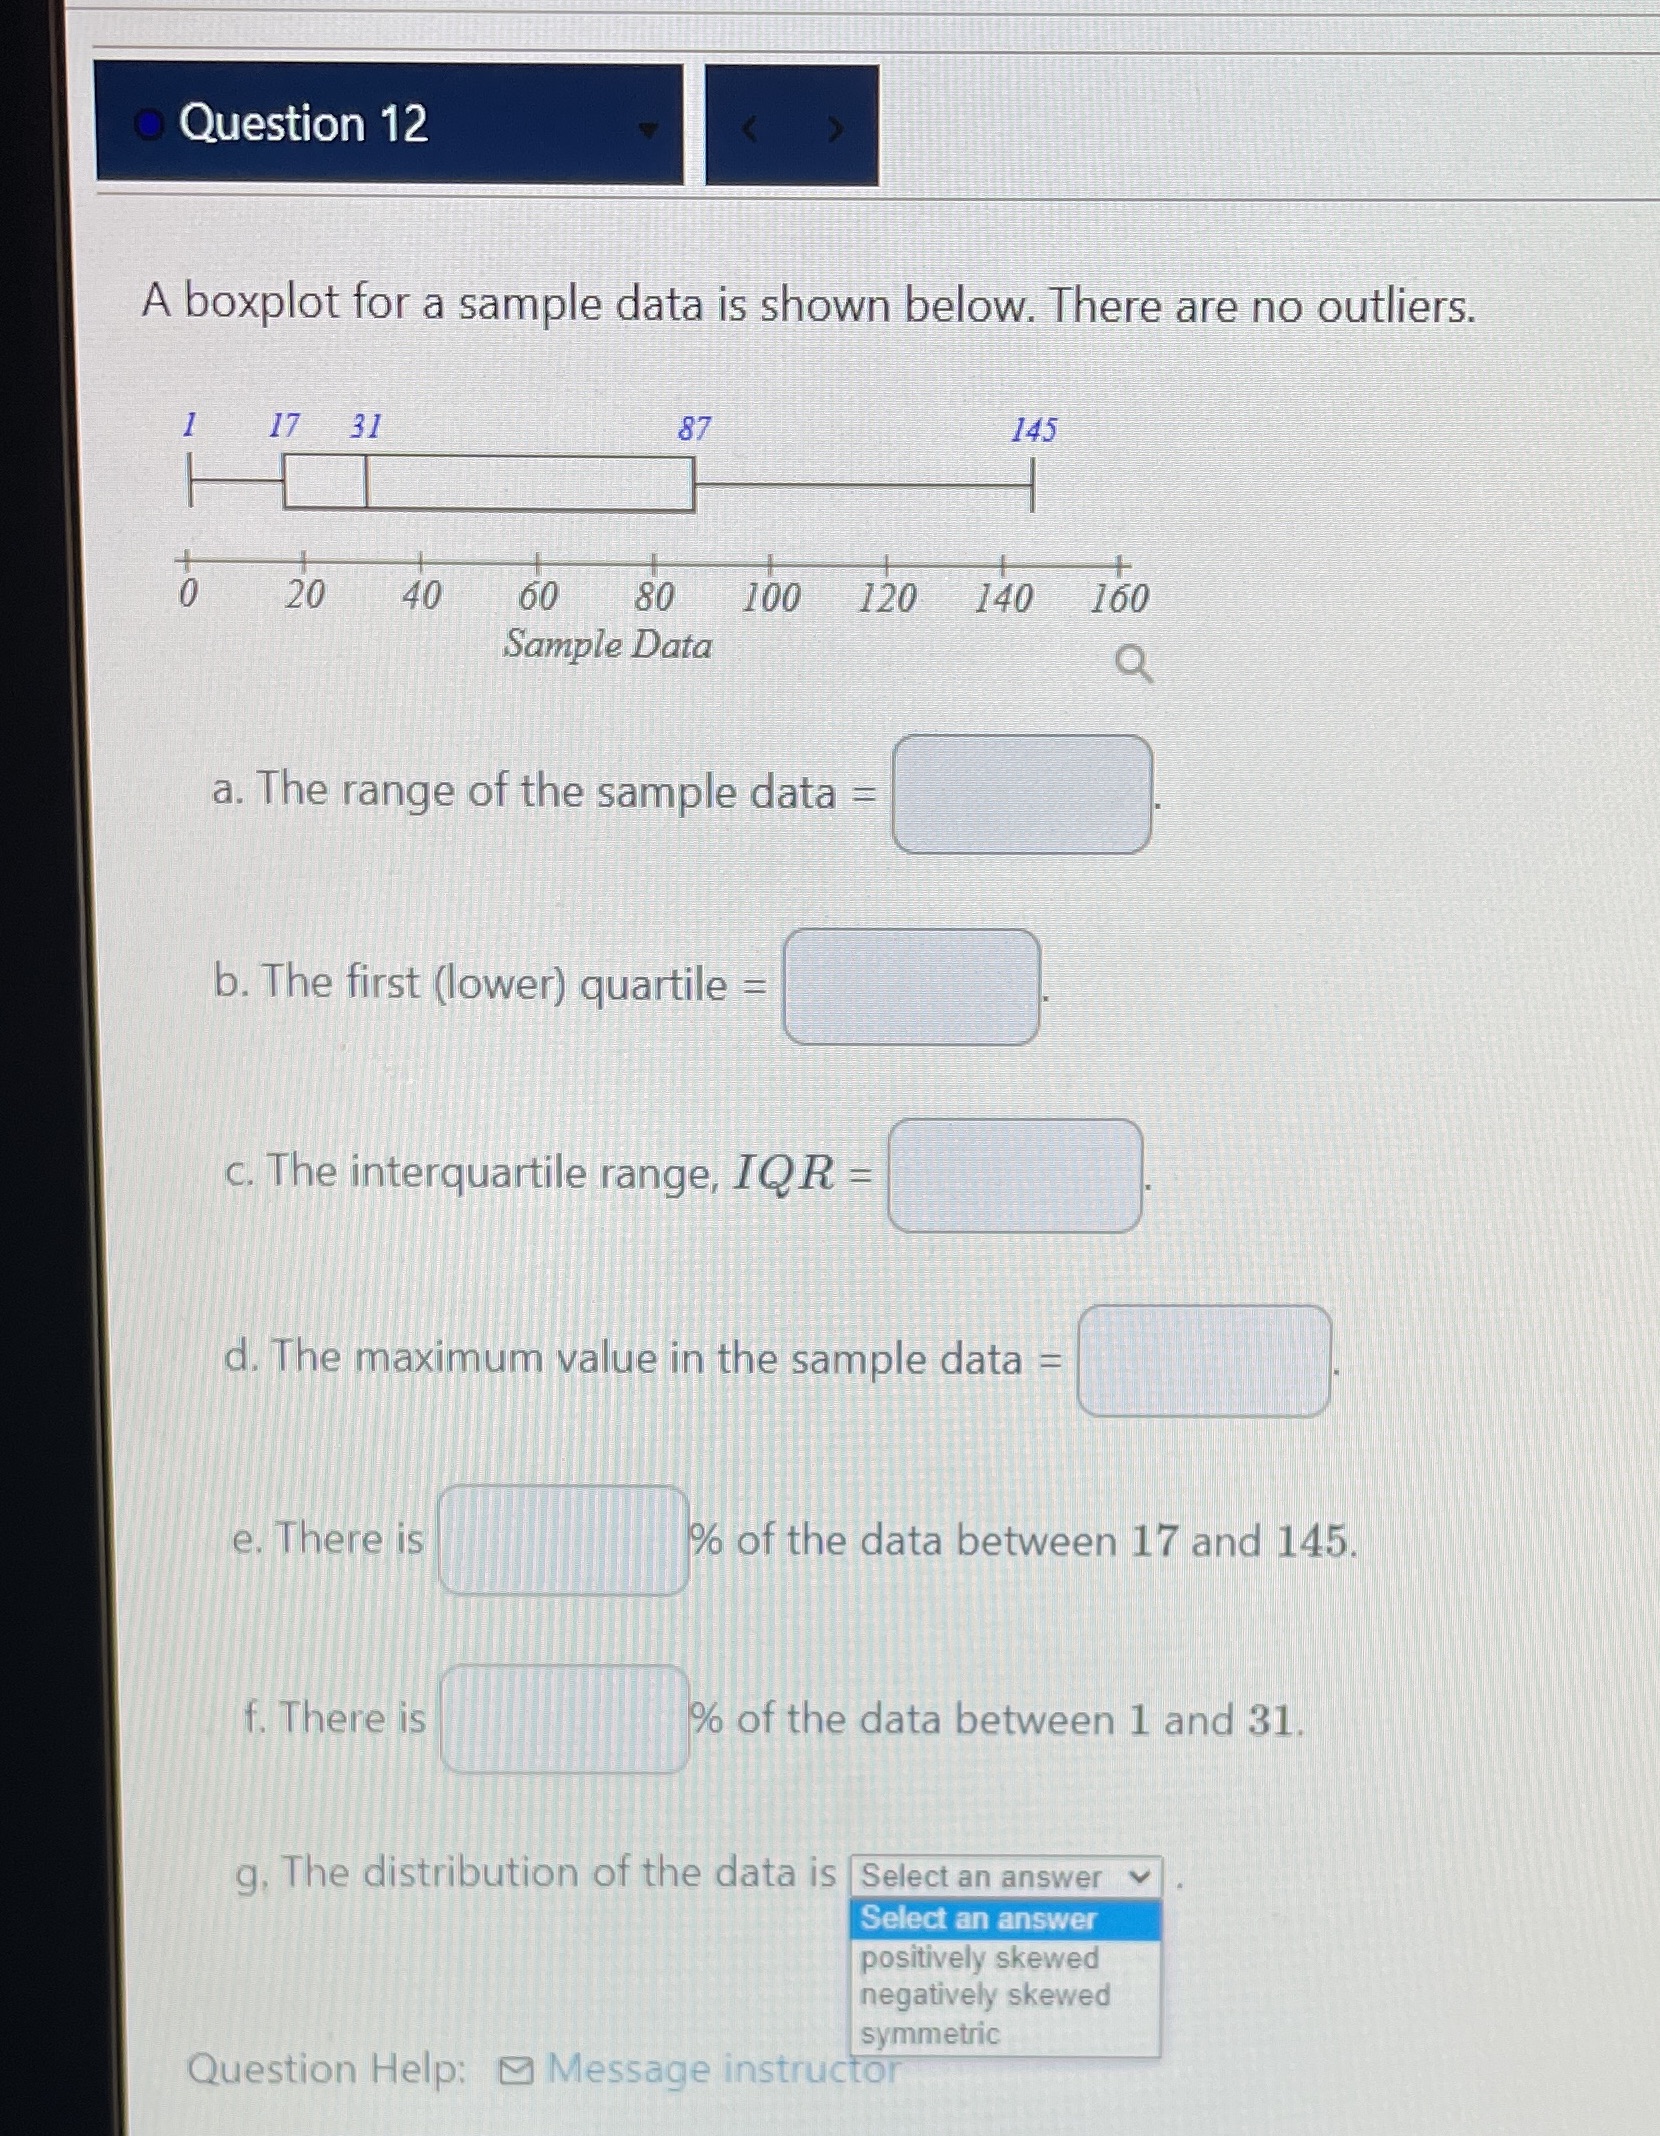
. Question 12 A boxplot for a sample data is shown below. There are no outliers. 17 31 145 20 40 60 80 100 120
Step by Step Solution
There are 3 Steps involved in it
Step: 1

Get Instant Access to Expert-Tailored Solutions
See step-by-step solutions with expert insights and AI powered tools for academic success
Step: 2

Step: 3
Ace Your Homework with AI
Get the answers you need in no time with our AI-driven, step-by-step assistance
Get Started
Theory Of Distributions
Authors: Svetlin G Georgiev
1st Edition
3319195271, 9783319195278