

Answered step by step
Verified Expert Solution
Question
1 Approved Answer
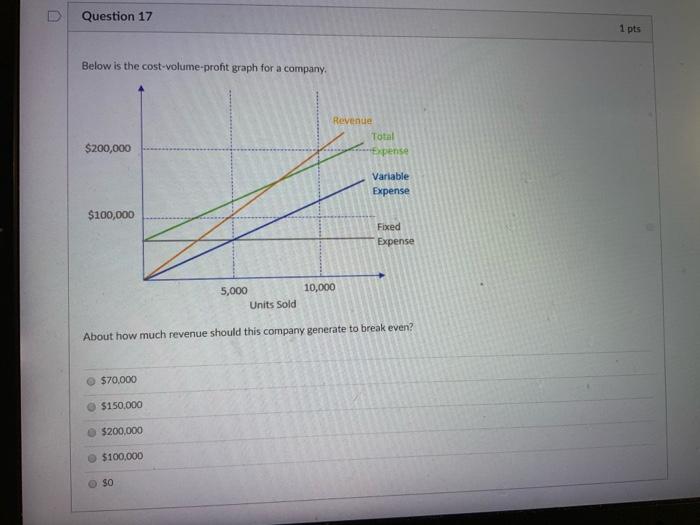
Question 17 1 pts Below is the cost-volume-profit graph for a company. Revenue Total Expense $200,000 Variable Expense $100,000 Fixed Expense 10,000 5,000 Units Sold
Step by Step Solution
There are 3 Steps involved in it
Step: 1

Get Instant Access to Expert-Tailored Solutions
See step-by-step solutions with expert insights and AI powered tools for academic success
Step: 2

Step: 3
Ace Your Homework with AI
Get the answers you need in no time with our AI-driven, step-by-step assistance
Get Started
Artificial Intelligence In Accounting And Auditing Knowledge Representation Accounting Applications And The Future Volume 3
Authors: Miklos A. Vasarhelyi
1st Edition
1558760784, 978-1558760783