

Answered step by step
Verified Expert Solution
Question
1 Approved Answer
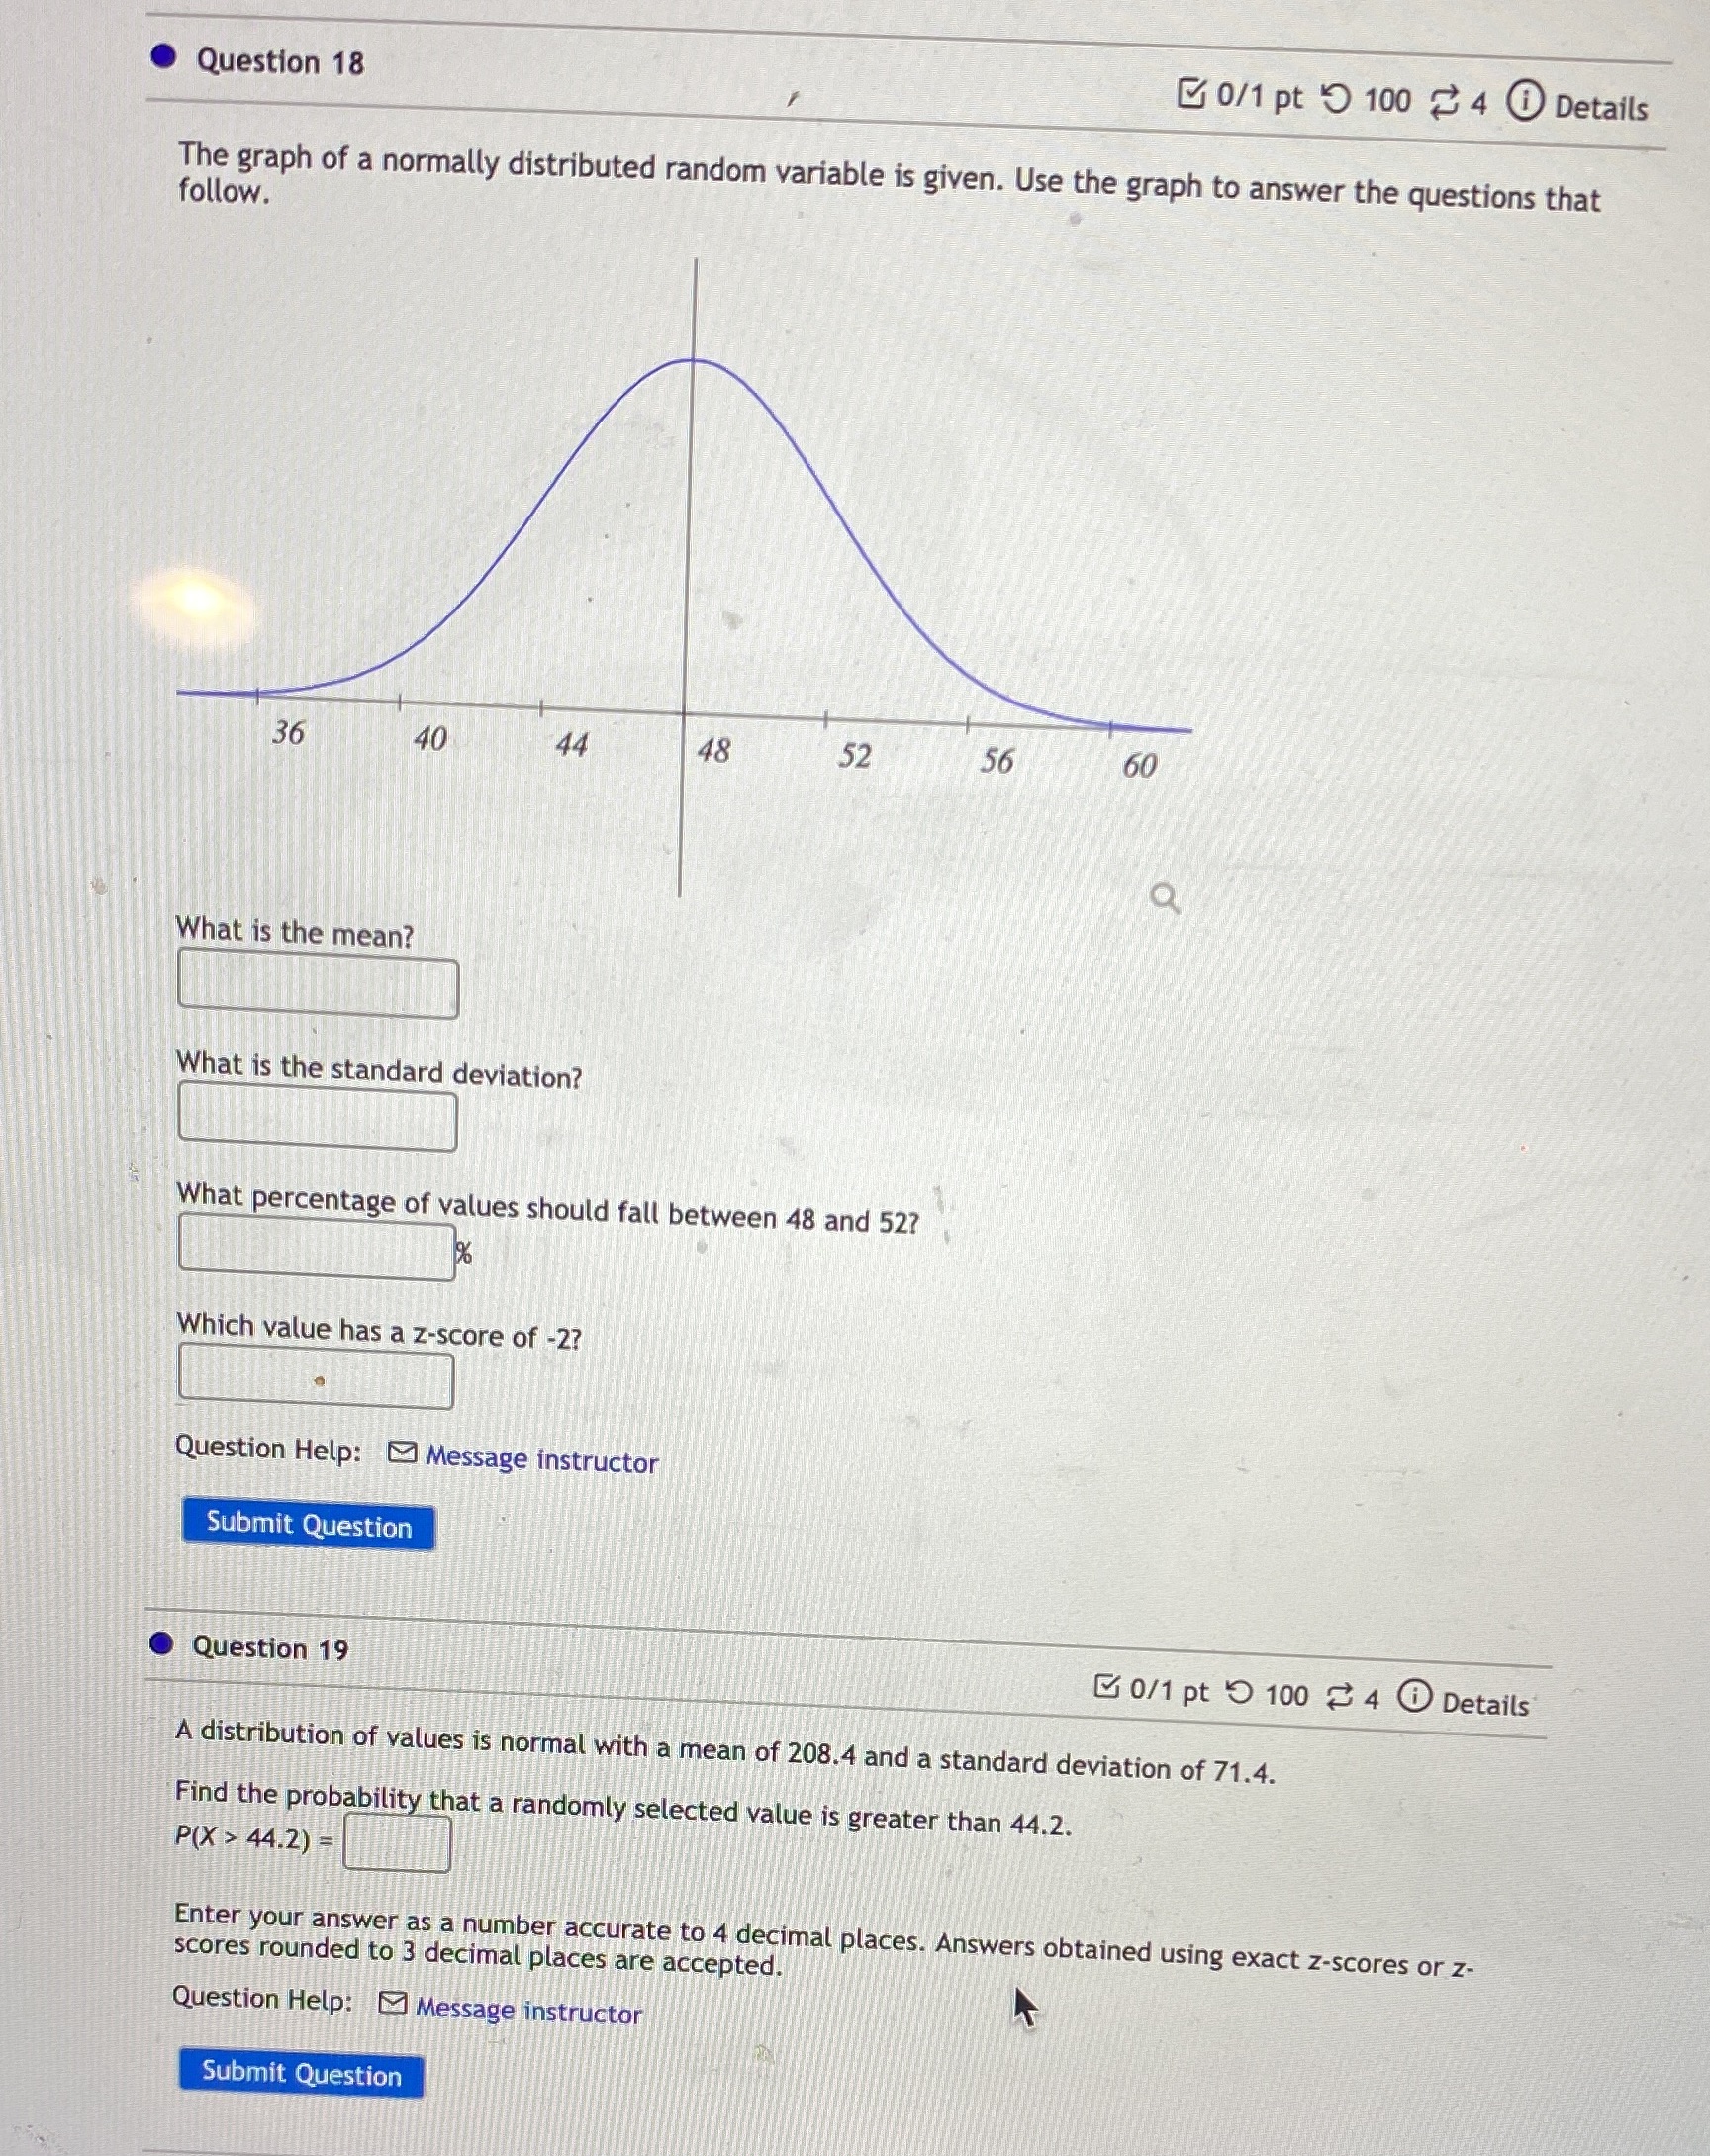
Question 18 0/1 pt 9 100 ~ 4 0 Details The graph of a normally distributed random variable is given. Use the graph to answer
Step by Step Solution
There are 3 Steps involved in it
Step: 1

Get Instant Access to Expert-Tailored Solutions
See step-by-step solutions with expert insights and AI powered tools for academic success
Step: 2

Step: 3
Ace Your Homework with AI
Get the answers you need in no time with our AI-driven, step-by-step assistance
Get Started
Finite Mathematics
Authors: Stefan Waner, Jerry Lee Ford Jr, Waner/Costenoble, Steven Costenoble
5th Edition
1111789304, 9781111789305