Answered step by step
Verified Expert Solution
Link Copied!

Question

1 Approved Answer

Question 191 After taking 8 samples (each sample contains 5 parts) you want to calculate the control limits of the X-bar and R charts. Use
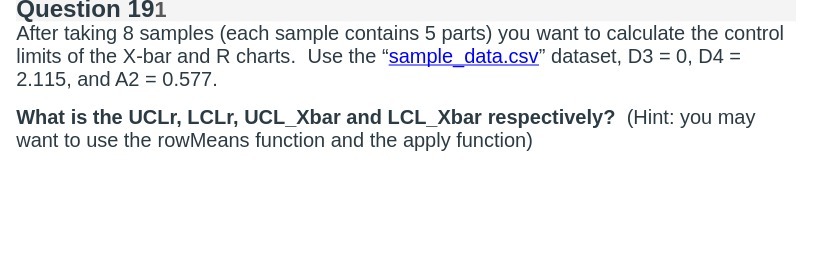
image text in transcribed
Question 191 After taking 8 samples (each sample contains 5 parts) you want to calculate the control limits of the X-bar and R charts. Use the "sample_data.csv" dataset, D3 = 0, D4 = 2.115, and A2 = 0.577. What is the UCLr, LCLr, UCL_Xbar and LCL_Xbar respectively? (Hint: you may want to use the rowMeans function and the apply function)

Step by Step Solution

There are 3 Steps involved in it

Step: 1

blur-text-image

Get Instant Access to Expert-Tailored Solutions

See step-by-step solutions with expert insights and AI powered tools for academic success

Step: 2

blur-text-image

Step: 3

blur-text-image

Ace Your Homework with AI

Get the answers you need in no time with our AI-driven, step-by-step assistance

Get Started

Recommended Textbook for

Finite Math And Applied Calculus

Authors: Stefan Waner, Steven Costenoble

6th Edition

1285415132, 9781285415130

More Books

Students also viewed these Mathematics questions

Question

What are the purposes of promotion ?

Answered: 1 week ago