Question
Question 1)What is the ticket price per person to balance the initial budget using Goal Seek? 2)For the onevariable data table, how many attendees creates
Question 1)What is the ticket price per person to balance the initial budget using Goal Seek? 2)For the onevariable data table, how many attendees creates the largest deficit? 3)For the onevariable data table, what is the largest deficit? 4)For the onevariable data table, how many attendees creates a breakeven point? 5)For the twovariable data table, what ticket prices do not produce a breakeven point? 6)For the twovariable data table, list the combination of ticket prices and attendees that produce a break-even point? 7)For the scenario summary, which scenario provides the highest positive balance and by what amount? 8)For the scenario summary, which scenario provides a negative balance? What is the balance? 9)Is this balance close enough that you might achieve break even? How is this possible? 10)What is the most profit you can generate within the constraints using Solver? 11)How much would you need to charge per ticket to reach that profit level? 12)How many total tickets would you need to sell at that price? 13)What constraints prevented Solver from reaching a higher profit level?
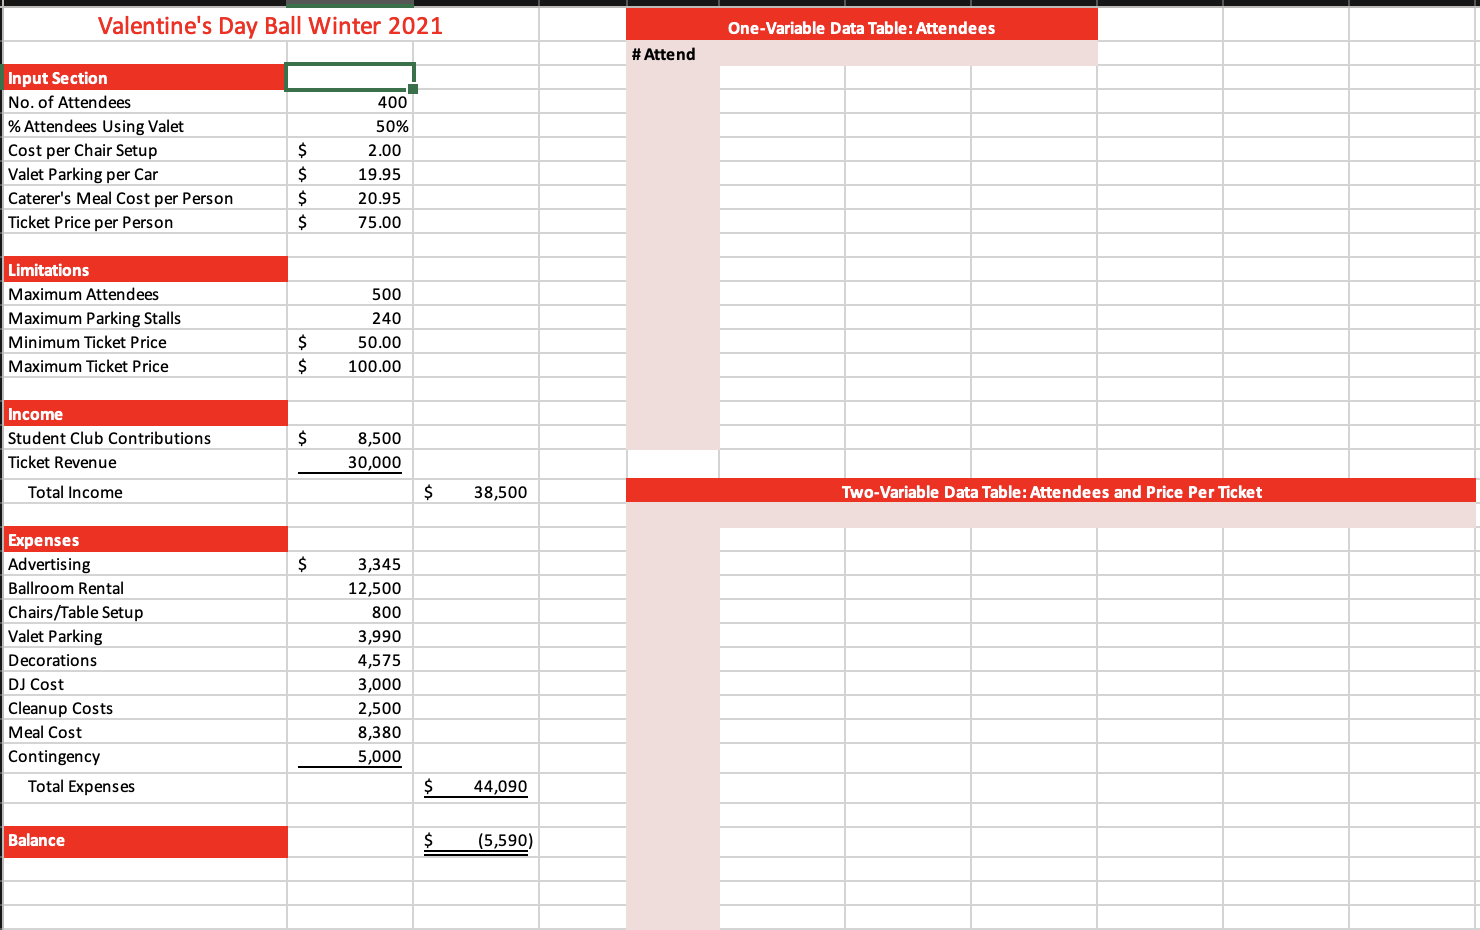
You are on the budget committee for the formal Valentines Day Ball at your university. The ball includes dinner and dancing. Your committee have prepared a tentative budget outlining income and expenses in the attached Dance file. The primary sources of income are contributions from student organizations and ticket prices. Expenses include the actual cost of the dinner, facilities, parking, and other costs at a luxurious hotel in the city. Your goal is to balance the income and expenses, decide on the most appropriate ticket price per student, and ensure your budget falls within the limitations you must work with. You decide to use Excel What-If Analysis tools to help you make proper decision.
Currently, the estimated budget has a deficit. Use Goal Seek to achieve a $0 balance by changing the ticket price per person. Answer question 1 on the Q&A worksheet.
You believe that between 200 and 500 students will attend. Because the ticket revenue, chair setup, catering cost, and valet parking expenses are dependent on the number of students, you decide to create a one-variable data table to compare the budget effects based on different number of students attending. Using What-If analysis tool to build the one-variable data table, based on the ticket price that makes a $0 balance. The one-variable data table contains four columns: # Attend, Total Revenue, Total Expenses, and Balance. In the first column, enter the series of substitution values ranging from 200 to 500 at increments of 20 students. Enter references to the total revenue, total expenses, and balance formulas in the correct location for the one-variable data table. Complete the one-variable data table and then answer questions 2 through 4 on the Q&A worksheet.
Now you want to compare the balance of different combinations of attendees and ticket prices per person using a two-variable data table. Using the same series of substitution values for # Attend from the one-variable data table. Enter the series of substitution values for ticket price from $50 to $100 at $10 increments. Enter the reference to the total income formula in the correct location for the two variable data table. Complete the two-variable data table and answer questions 5 and 6 on the Q&A worksheet. Question 6 requires three combinations to list.
You negotiated different cost per meal and ballroom rental rates based on 500, 400, 300, or 200 attendees. You estimated tentative ticket prices per attendee. You use Scenario Manager to help you decide the target number of attendees. Create a first scenario named 500 Attend, using the number of attendees, meal cost per person, ticket price per person, and ballroom rental variables as the changing cells. Enter these values for the first scenario: 500, $15.95, $75 and $12500. Create a second scenario named 400 Attend, using the same changing cells, entering these values for the second scenario: 400, $17.95, $85, and $12500. Create a third scenario named 300 Attend, using the same changing cells, entering these values for the third scenario: 300, $19.95, $90, and $11995. Create a fourth scenario named 200 Attend, using the same changing cells, entering these values for the fourth scenario: 200, $22.95, $95, and $11995. Then generate a scenario summary report using the total revenue, total expenses, and balance as the results, and then answer question 7 through 9 on the Q&A worksheet.
Save the workbook.
If you forgot how to use these What-If analysis tools (Goal Seek, One-variable Data Table, Two-variable Data Table, and Scenario Analysis), type these key words to find learning materials online.

Please help asap and show step by step with excel formulas
Step by Step Solution
There are 3 Steps involved in it
Step: 1

Get Instant Access to Expert-Tailored Solutions
See step-by-step solutions with expert insights and AI powered tools for academic success
Step: 2

Step: 3

Ace Your Homework with AI
Get the answers you need in no time with our AI-driven, step-by-step assistance
Get Started


