Answered step by step
Verified Expert Solution
Link Copied!

Question

1 Approved Answer

Question 2 [10] The trajectories (time-space diagrams) of a group of vehicles were recorded at a site from a US motorway (i.e. NGSIM data, see
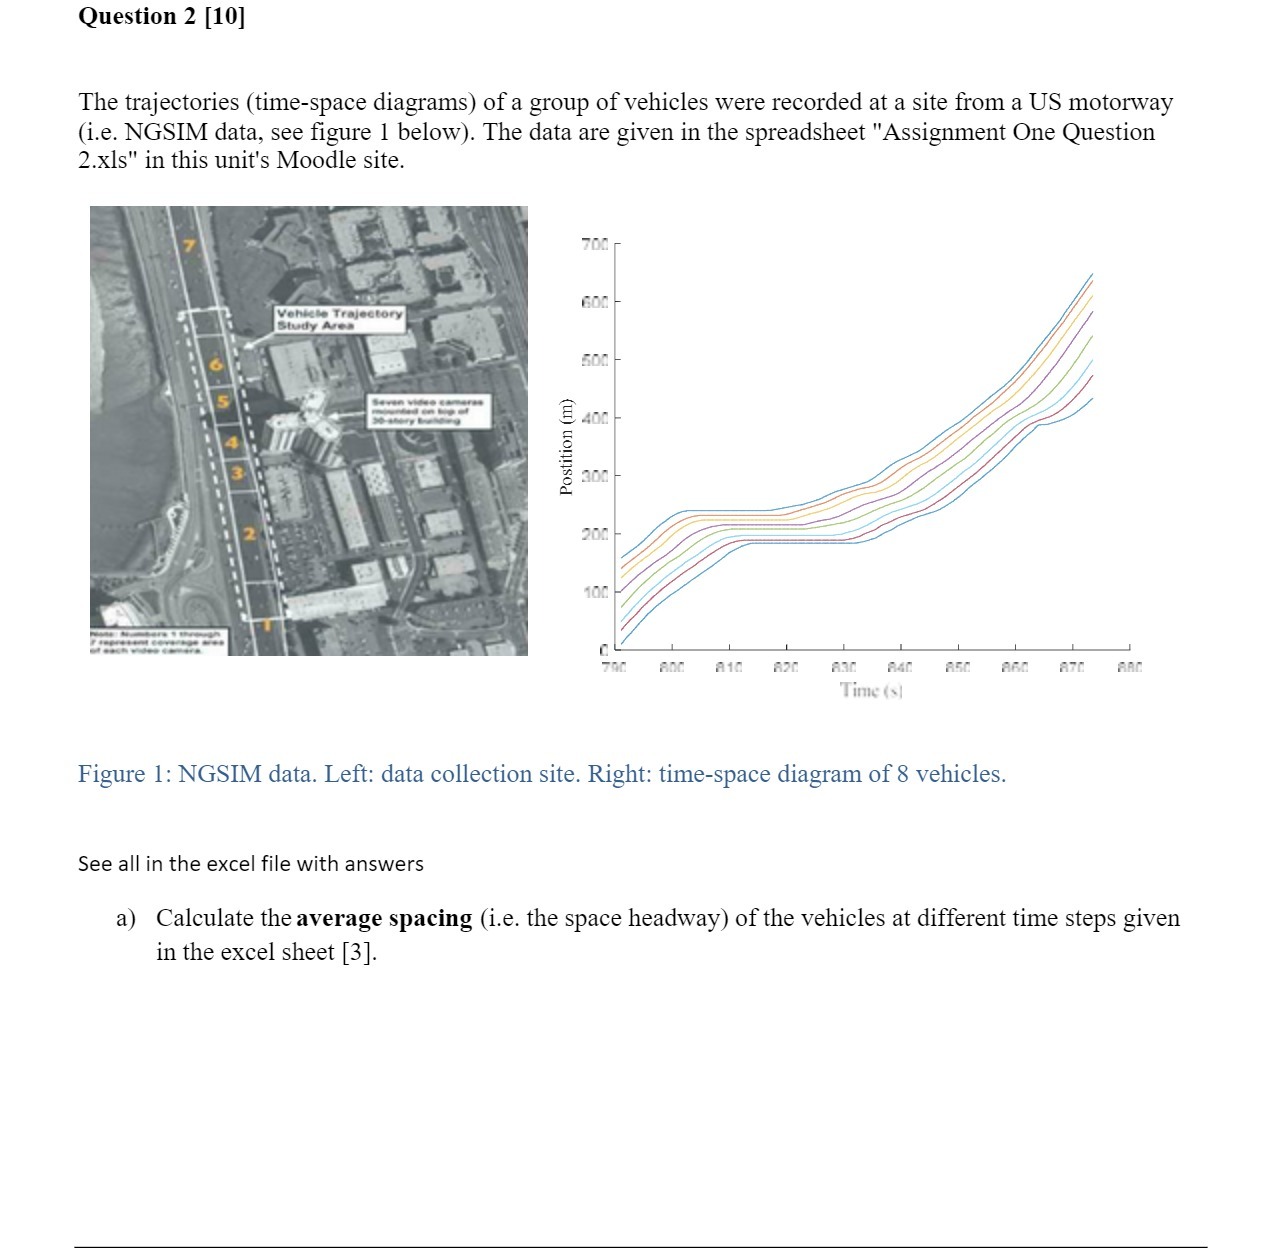
image text in transcribed
Question 2 [10] The trajectories (time-space diagrams) of a group of vehicles were recorded at a site from a US motorway (i.e. NGSIM data, see figure 1 below). The data are given in the spreadsheet "Assignment One Question 2.xls" in this unit's Moodle site. 700 Vehicle Trajectory 500 400 Postition (m) 300 N 200 100 790 and A10 A70 ARC Time (s) Figure 1: NGSIM data. Left: data collection site. Right: time-space diagram of 8 vehicles. See all in the excel file with answers a) Calculate the average spacing (i.e. the space headway) of the vehicles at different time steps given in the excel sheet [3]

Step by Step Solution

There are 3 Steps involved in it

Step: 1

blur-text-image

Get Instant Access to Expert-Tailored Solutions

See step-by-step solutions with expert insights and AI powered tools for academic success

Step: 2

blur-text-image

Step: 3

blur-text-image

Ace Your Homework with AI

Get the answers you need in no time with our AI-driven, step-by-step assistance

Get Started

Recommended Textbook for

Modeling And Analysis Of Dynamic Systems

Authors: Ramin S. Esfandiari, Bei Lu

3rd Edition

1138726427, 9781138726420

More Books

Students also viewed these Mathematics questions