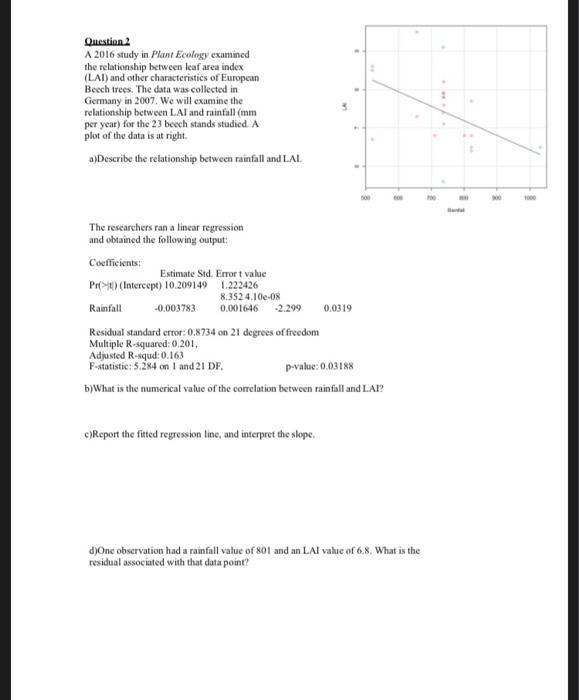
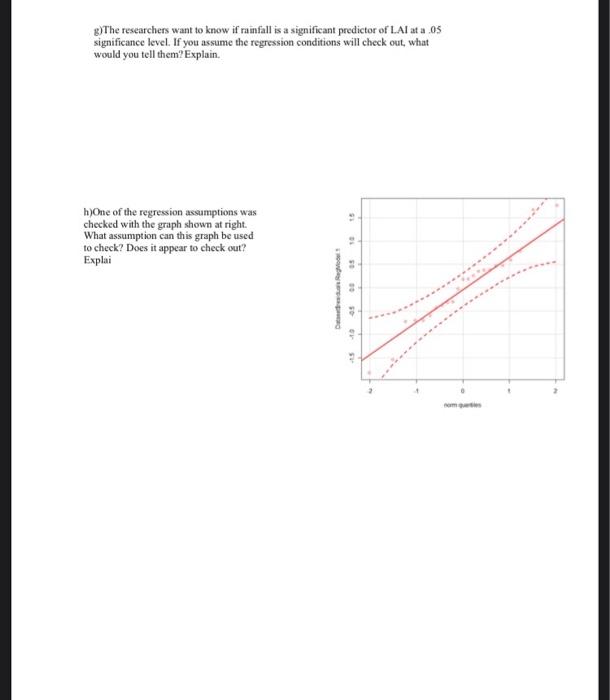
Question 2 A 2016 study in Plant Ecology examined the relationship between leaf area index (LAI) and other characteristics of European Beech trees. The data was collected in Germany in 2007. We will examine the relationship between LAI and rainfall (mm per year) for the 23 beech stands studied. A plot of the data is at right a)Describe the relationship between rainfall and LAI The researchers ran a linear regression and obtained the following output: Coefficients: Estimate Std. Errort value Prt-10 (Intercept) 10.209149 1222426 8.3524.10.08 Rainfall -0.003783 0.001646 2.299 0.0319 Residual standard error: 0.8734 on 21 degrees of freedom Multiple R-squared: 0.201. Adjusted R-squd: 0.163 F-statistic: 5.284 on 1 and 21 DF. p-value: 0.03188 b)What is the numerical value of the correlation between rainfall and LAI? c)Report the fitted regression tine, and interpret the slope. d)One observation had a rainfall value of 801 and an LAI value of 6.8. What is the residual associated with that data point? e) How well does the regression appear to fit? Explain, using two statistics in your justification Test 1: Null hypothesis: Alternative Hypothesis: Test Statistic (how to calculate-formula and value): Distribution of Test Stat (name, parameters): P-value (state how to calculate and then use the output): Conclusion: Null hypothesis: Alternative Hypothesis: Test Statistic (how to calculate - formula and value) Distribution of Test Stat (name, parameters) P-value (state how to calculate and then use the output) Conclusion: Interpret the R-squared value (explain the meaning, then give the number). How well you think this model fits the data? B)The researchers want to know if rainfall is a significant predictor of Lal at a 05 significance level. If you assume the regression conditions will check out, what would you tell them? Explain. 16 h)One of the regression assumptions was checked with the graph shown at right. What assumption can this graph be used to check? Does it appear to check out? Explai 10 GH 15