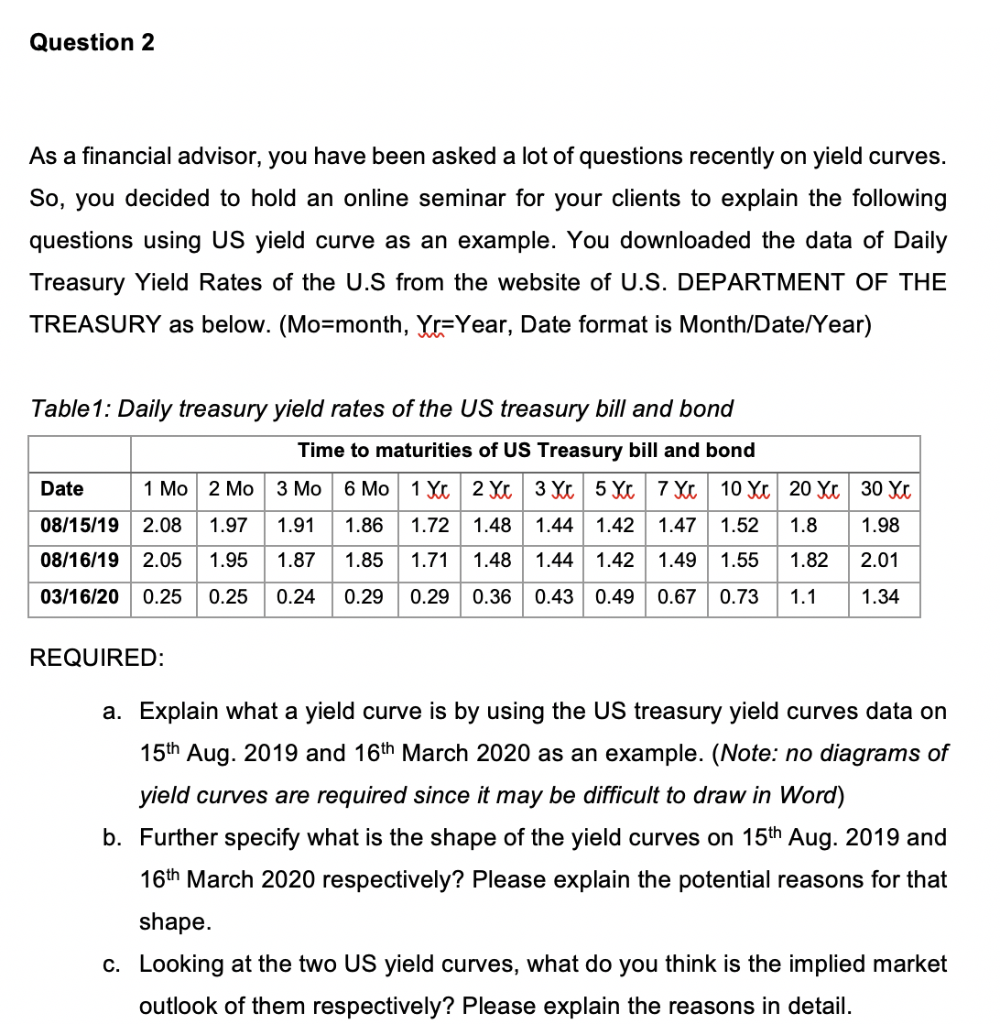
Question 2 As a financial advisor, you have been asked a lot of questions recently on yield curves. So, you decided to hold an online seminar for your clients to explain the following questions using US yield curve as an example. You downloaded the data of Daily Treasury Yield Rates of the U.S from the website of U.S. DEPARTMENT OF THE TREASURY as below. (Mormonth, Yr=Year, Date format is Month/Date/Year) Table 1: Daily treasury yield rates of the US treasury bill and bond Time to maturities of US Treasury bill and bond Date 1 Mo 2 Mo 3 Mo 6 Mo 1 Xc 2 X 3 Xc 5 Xc 7 Xc 10 Xc 20 Xc 08/15/19 2.08 1.97 1.91 1.86 1.72 1.48 1.44 1.42 1.47 1.52 1.8 08/16/19 2.05 1.95 1.87 1.85 1.71 1.48 1.44 1.42 1.49 1.55 1.82 03/16/20 0.25 0.25 0.24 0.29 0.29 0.36 0.43 0.49 0.67 0.73 1.1 1.98 2.01 1.34 REQUIRED: a. Explain what a yield curve is by using the US treasury yield curves data on 15th Aug. 2019 and 16th March 2020 as an example. (Note: no diagrams of yield curves are required since it may be difficult to draw in Word) b. Further specify what is the shape of the yield curves on 15th Aug. 2019 and shape. c. Looking at the two US yield curves, what do you think is the implied market outlook of them respectively? Please explain the reasons in detail. Question 2 As a financial advisor, you have been asked a lot of questions recently on yield curves. So, you decided to hold an online seminar for your clients to explain the following questions using US yield curve as an example. You downloaded the data of Daily Treasury Yield Rates of the U.S from the website of U.S. DEPARTMENT OF THE TREASURY as below. (Mormonth, Yr=Year, Date format is Month/Date/Year) Table 1: Daily treasury yield rates of the US treasury bill and bond Time to maturities of US Treasury bill and bond Date 1 Mo 2 Mo 3 Mo 6 Mo 1 Xc 2 X 3 Xc 5 Xc 7 Xc 10 Xc 20 Xc 08/15/19 2.08 1.97 1.91 1.86 1.72 1.48 1.44 1.42 1.47 1.52 1.8 08/16/19 2.05 1.95 1.87 1.85 1.71 1.48 1.44 1.42 1.49 1.55 1.82 03/16/20 0.25 0.25 0.24 0.29 0.29 0.36 0.43 0.49 0.67 0.73 1.1 1.98 2.01 1.34 REQUIRED: a. Explain what a yield curve is by using the US treasury yield curves data on 15th Aug. 2019 and 16th March 2020 as an example. (Note: no diagrams of yield curves are required since it may be difficult to draw in Word) b. Further specify what is the shape of the yield curves on 15th Aug. 2019 and shape. c. Looking at the two US yield curves, what do you think is the implied market outlook of them respectively? Please explain the reasons in detail