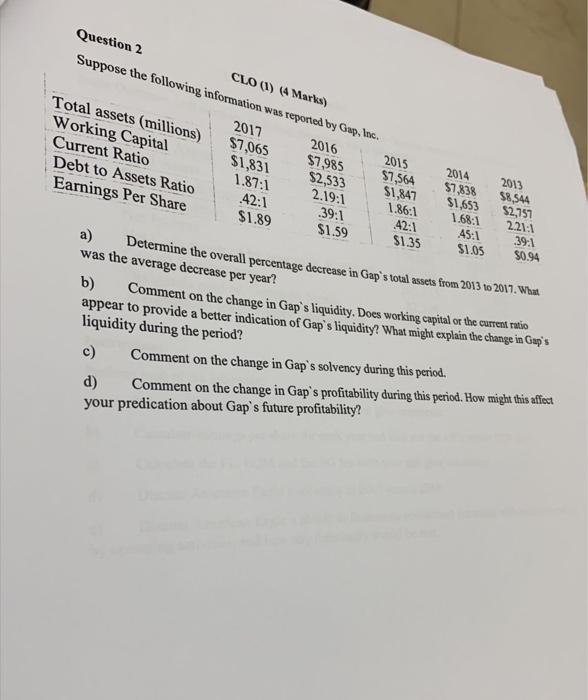
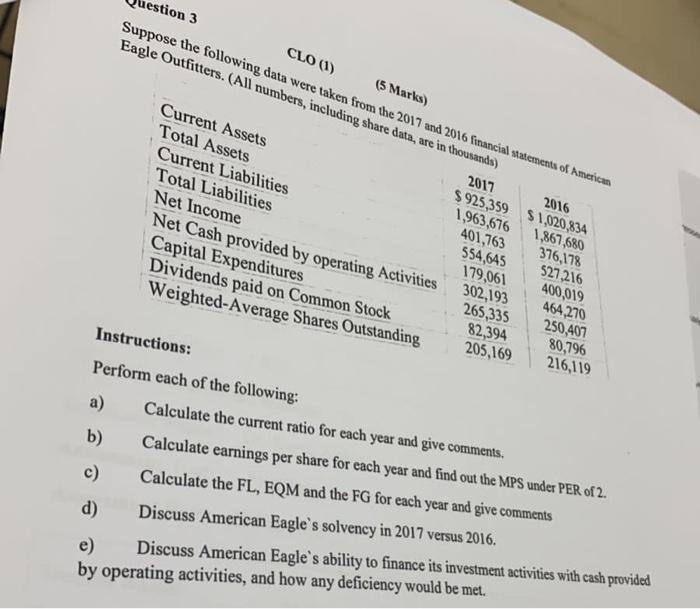
Question 2 CLO (1) (A Marks) Suppose the following information was reported by Gup, Inc. 2017 2016 Total assets (millions) $7,065 $7985 57,564 Working Capital $1,831 $2,533 Current Ratio 1.87:1 Debt to Assets Ratio Earnings Per Share $1.89 2015 2014 2013 $7838 $8,544 $1,847 2.19:1 $1,653 $2,757 42:1 1.86:1 1.68:1 221: .39:1 .42:1 A5:1 39-1 $1.59 $1.35 $1.05 $0.94 a) Determine the overall percentage decrease in Gap's total assets from 2013 to 2017. What was the average decrease per year? b) Comment on the change in Gap's liquidity. Does working capital or the current ratio appear to provide a better indication of Gap's liquidity? What might explain the change in Gup's liquidity during the period? Comment on the change in Gap's solvency during this period. c) d) Comment on the change in Gap's profitability during this period. How might this affect your predication about Gap's future profitability? estion 3 CLO (1) (5 Marks) Suppose the following data were taken from the 2017 and 2016 financial statements of Americom Eagle Outfitters. (All numbers, including share data, are in thousands) Current Assets 2017 2016 Total Assets $ 925,359 $1,020,834 Current Liabilities 1,963,676 1,867,680 Total Liabilities 401,763 376,178 554,645 527216 Net Income 179,061 400,019 Net Cash provided by operating Activities 302,193 464,270 Capital Expenditures 265,335 Dividends paid on Common Stock 82,394 Weighted-Average Shares Outstanding 250,407 80,796 205,169 216,119 Instructions: Perform each of the following: a) Calculate the current ratio for each year and give comments. b) Calculate earnings per share for each year and find out the MPS under PER of 2. Calculate the FL, EQM and the FG for each year and give comments Discuss American Eagle's solvency in 2017 versus 2016. c) d) e) Discuss American Eagle's ability to finance its investment activities with cash provided by operating activities, and how any deficiency would be met