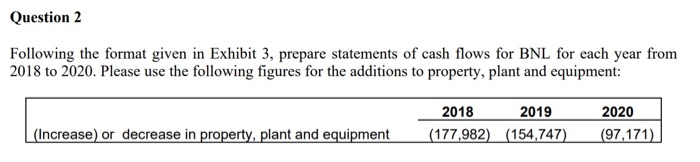
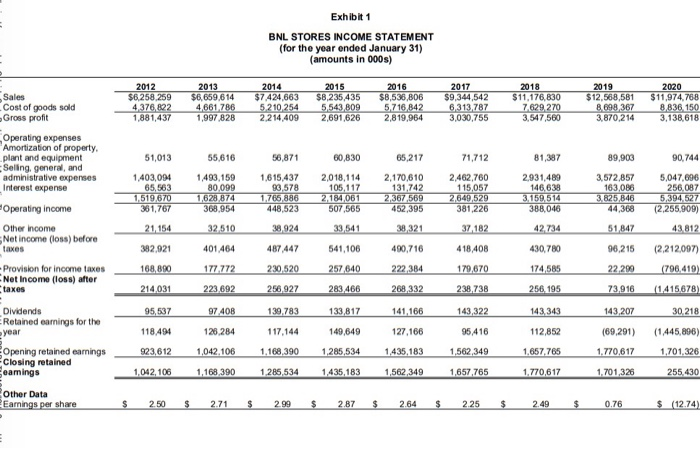
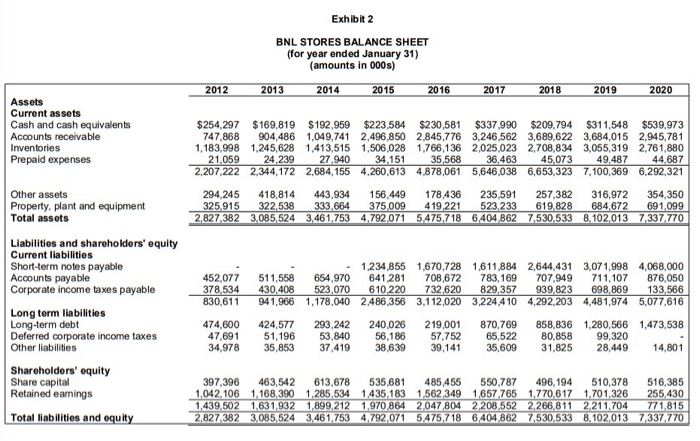
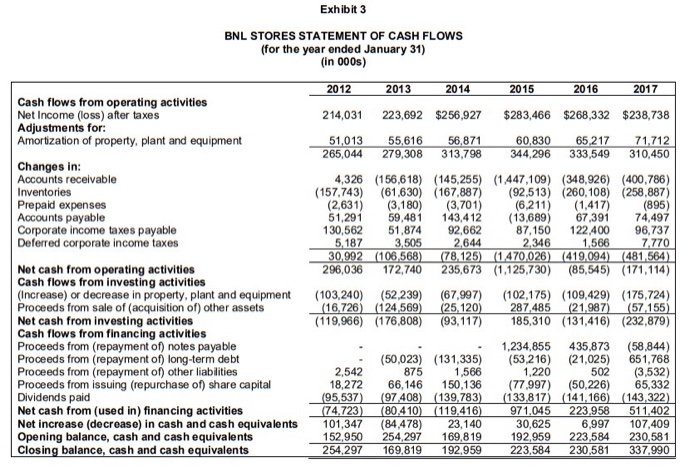
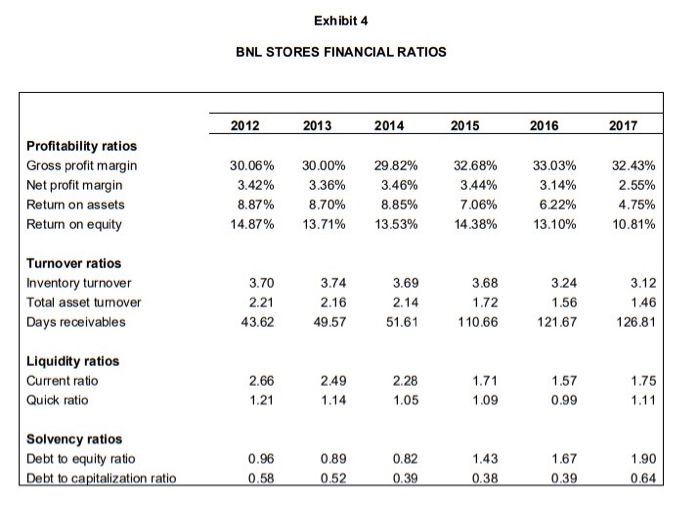
Question 2 Following the format given in Exhibit 3, prepare statements of cash flows for BNL for each year from 2018 to 2020. Please use the following figures for the additions to property, plant and equipment: 2018 2019 (177,982) (154,747) 2020 (97,171) (Increase) or decrease in property, plant and equipment Exhibit 1 BNL STORES INCOME STATEMENT (for the year ended January 31) (amounts in 000s) Sales Cost of goods sold Gross profit 2012 $6,258,259 4376822 1,881,437 2013 $6,659,614 4,661 786 1,997 828 2014 $7,424,663 5210254 2.214.409 2015 $8,235,435 5,543 809 2,691,626 2016 $8,536,806 5 716 842 2,819,964 2017 $9,344,542 6,313787 3,030,755 2018 $11,176,830 7.629 270 3,547,560 2019 $12,568,581 8.698,367 3.870,214 2020 $11,974.768 8,836. 150 3,138,618 55,616 56,871 60,830 65,217 71,712 81,387 89,903 90.744 Operating expenses Amortization of property plant and equipment Seling, general, and administrative expenses Interest expense Operating income Other Income Net income (loss) before taxes 51,013 1.403,094 65,563 1,519,670 361,767 1,493.159 80,099 1,628 874 368,954 1,615,437 93,578 1,765,886 448,523 2,018,114 105,117 2,184,061 507,565 2,170,610 131,742 2,367,569 452,395 2,462,760 115,057 2,649,529 381,226 2,931,489 146,638 3.159,514 388,046 3,572,857 163,086 3.825 846 44,308 5,047,696 256,087 5,394,527 (2,255,909) 21,154 32 510 38.924 33541 38321 37.182 42734 51 847 43 812 382,921 401.464 487.447 541,106 490,716 418,408 430780 96,215 (2,212.097) 168,890 177 772 230,520 257 640 222 384 179,670 174,585 22 200 (796,419) Provision for income taxes Net Income (loss) after taxes 214,031 223 692 256.927 283 466 268332 238 738 256, 195 73,916 (1,415.678) 95,587 97 408 139.783 133 817 141,166 143,322 143,343 143,207 30.218 118.494 126,284 117,144 149,649 127,166 95,416 112,852 (69,291) (1.445,896) Dividends Retained earnings for the year Opening retained earnings Closing retained eamings 923,612 1,042,106 1.168,390 1,285,534 1,435,183 1,562,349 1.657, 765 1.770.617 1,701,326 1,042, 106 1,168 390 1 285,534 1,435,183 1,562,349 1,657 765 1.770,617 1.701,326 255 430 Other Data Earnings per share $ 2.50 $ 2.71 $ 2.99 $ 2.87 $ 2.64 $ 2.25 $ 2.49 $ 0.76 $ (12.74) Exhibit 2 BNL STORES BALANCE SHEET (for year ended January 31) (amounts in 000s) 2012 2013 2014 2015 2016 2017 2018 2019 2020 Assets Current assets Cash and cash equivalents Accounts receivable Inventories Prepaid expenses $254,297 $169,819 $192,959 $223,584 $230,581 $337.990 $209,794 $311,548 $539,973 747,868 904,486 1,049,741 2,496,850 2,845,776 3.246,562 3,689,622 3,684,015 2,945,781 1,183,998 1,245,628 1,413,515 1.506,028 1,766,136 2,025,023 2,708,834 3,055,319 2,761,880 21,059 24,239 27,940 34,151 35,568 36,463 45,073 49,487 44,687 2,207,222 2,344,172 2,684,155 4.260,613 4,878,061 5,646,038 6,653,323 7.100,369 6,292,321 294,245 418,814 443,934 156,449 178,436 235,591 257,382 316,972 354,350 325.915 322,538 333,664 375,009 419,221 523,233 619.828 684,672 691,099 2,827.382 3,085,524 3,461,753 4,792,071 5.475,718 6.404,862 7,530,533 8.102,013 7.337.770 452,077 378,534 830,611 Other assets Property, plant and equipment Total assets Liabilities and shareholders' equity Current liabilities Short-term notes payable Accounts payable Corporate income taxes payable Long term liabilities Long-term debt Deferred corporate income taxes Other liabilities Shareholders' equity Share capital Retained earnings Total liabilities and equity 1,234,855 1,670,728 1,611,884 2,644,431 3,07 1,998 4,068,000 511,558 654,970 641 281 708,672 783,169 707,949 711,107 876,050 430,408 523,070 610,220 732,620 829,357 939,823 698,869 133,566 941,966 1,178,040 2,486,356 3,112,020 3,224,410 4,292,203 4.481,974 5,077,616 474,600 47.691 34,978 424,577 51.196 35,853 293,242 53,840 37,419 240,026 56,186 38,639 219,001 57,752 39,141 870,769 65,522 35,609 858,836 1,280,566 1,473,538 80,858 99,320 31,825 28,449 14,801 397,396 463,542 613,678 535,681 485,455 550,787 496,194 510,378 516,385 1,042 106 1,168,390 1,285,534 1435 183 1,562,349 1,657,765 1,770,617 1,701,326 255,430 1,439,502 1,631,932 1,899,212 1.970,864 2,047,804 2,208,552 2,266,811 2.211,704 771,815 2,827,382 3,085,524 3,461,753 4,792,071 5475,718 6,404,862 7,530,533 8,102,013 7,337.770 Exhibit 3 BNL STORES STATEMENT OF CASH FLOWS (for the year ended January 31) (in 000s) 2012 2013 2014 2015 2016 2017 223,692 $256,927 $283,466 $268,332 $238,738 214,031 51,013 265,044 55,616 279,308 56,871 313,798 60,830 344,296 65,217 333,549 71.712 310,450 Cash flows from operating activities Net Income (loss) after taxes Adjustments for: Amortization of property, plant and equipment Changes in: Accounts receivable Inventories Prepaid expenses Accounts payable Corporate income taxes payable Deferred corporate income taxes Net cash from operating activities Cash flows from investing activities (Increase) or decrease in property, plant and equipment Proceeds from sale of (acquisition of) other assets Net cash from investing activities Cash flows from financing activities Proceeds from (repayment of) notes payable Proceeds from (repayment of) long-term debt Proceeds from (repayment of other liabilities Proceeds from issuing (repurchase of) share capital Dividends paid Net cash from (used in) financing activities Net increase (decrease) in cash and cash equivalents Opening balance, cash and cash equivalents Closing balance, cash and cash equivalents 4,326 (156,618) (145,255) (1.447,109) (348,926) (400 786) (157,743) (61.630) (167,887) (92,513) (260,108) (258,887) (2,631) (3,180) (3,701) (6.211) (1,417) (895) 51,291 59,481 143,412 (13,689) 67,391 74,497 130,562 51,874 92,662 87,150 122,400 96,737 5,187 3,505 2,644 2,346 1,566 7,770 30,992 (106,568) (78. 125) (1.470.026) (419,094) (481,564) 296,036 172,740 235,673 (1.125,730) (85,545) (171,114) (103,240) (52,239) (67,997) (102,175) (109,429) (175,724) (16,726) (124,569) (25 120) 287,485 (21,987) (57,155) (119,966) (176,808) (93,117) 185,310 (131,416) (232,879) 1,234,855 435.873 (58,844) (50,023) (131,335) (53,216) (21,025) 651,768 2,542 875 1,566 1,220 502 (3,532) 18,272 66,146 150,136 (77,997) (50,226) 65,332 (95,537) (97,408) (139,783) (133,817) (141,166) (143,322) (74,723) (80.410) (119.416) 971.045 223.958 511,402 101,347 (84 478) 23,140 30,625 6,997 107,409 152,950 254,297 169,819 192,959 223,584 30,58 254,297 169.819 192,959 223,584 230,581 337.990 Exhibit 4 BNL STORES FINANCIAL RATIOS 2012 2013 2014 2015 2016 2017 Profitability ratios Gross profit margin Net profit margin Return on assets Return on equity 30.06% 3.42% 8.87% 14.87% 30.00% 3.36% 8.70% 13.71% 29.82% 3.46% 8.85% 13.53% 32.68% 3.44% 7.06% 14.38% 33.03% 3.14% 6.22% 13.10% 32.43% 2.55% 4.75% 10.81% Turnover ratios Inventory turnover Total asset tumover Days receivables 3.70 2.21 43.62 3.74 2.16 49.57 3.69 2.14 51.61 3.68 1.72 110.66 3.24 1.56 121.67 3.12 1.46 126.81 Liquidity ratios Current ratio Quick ratio 2.66 1.21 2.49 1.14 2.28 1.05 1.71 1.09 1.57 0.99 1.75 1.11 Solvency ratios Debt to equity ratio Debt to capitalization ratio 0.96 0.58 0.89 0.52 0.82 0.39 1.43 0.38 1.67 0.39 1.90 0.64