Question: Question # 2 : ( Frequency Filtering ) This question will study a high - pass filter in the frequency domain and apply it to
Question #: Frequency Filtering
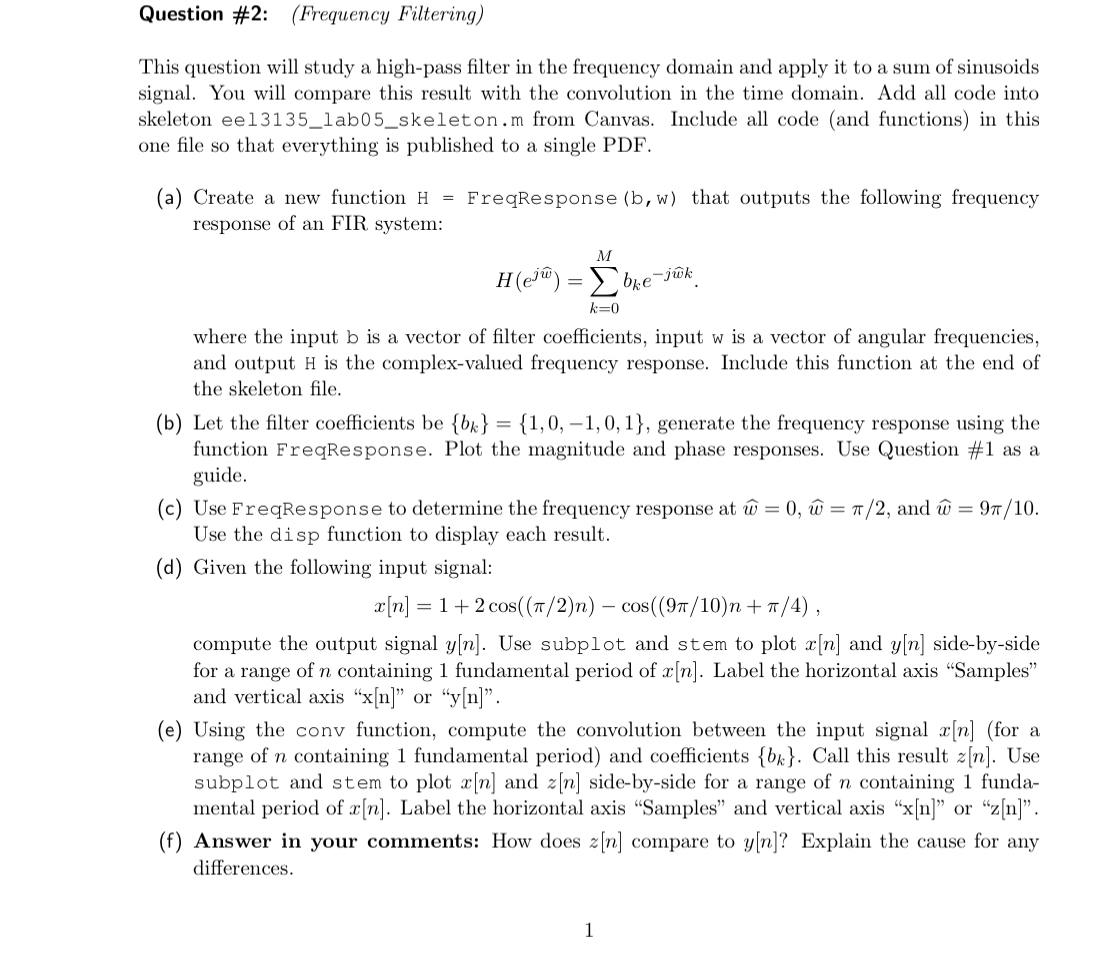
This question will study a highpass filter in the frequency domain and apply it to a sum of sinusoids signal. You will compare this result with the convolution in the time domain. Add all code into skeleton eelabskeleton.m from Canvas. Include all code and functions in this one file so that everything is published to a single PDF
a Create a new function FreqResponse that outputs the following frequency response of an FIR system:
where the input is a vector of filter coefficients, input is a vector of angular frequencies, and output is the complexvalued frequency response. Include this function at the end of the skeleton file.
b Let the filter coefficients be generate the frequency response using the function FreqResponse. Plot the magnitude and phase responses. Use Question # as a guide.
c Use FreqResponse to determine the frequency response at widehatwidehat and widehat Use the disp function to display each result.
d Given the following input signal:
compute the output signal Use subplot and stem to plot and sidebyside for a range of containing fundamental period of Label the horizontal axis "Samples" and vertical axis or yn
e Using the conv function, compute the convolution between the input signal for a range of containing fundamental period and coefficients Call this result Use subplot and stem to plot and sidebyside for a range of containing fundamental period of Label the horizontal axis "Samples" and vertical axis xn or zn
f Answer in your comments: How does compare to Explain the cause for any differences.

Step by Step Solution
There are 3 Steps involved in it
1 Expert Approved Answer
Step: 1 Unlock


Question Has Been Solved by an Expert!
Get step-by-step solutions from verified subject matter experts
Step: 2 Unlock
Step: 3 Unlock


